


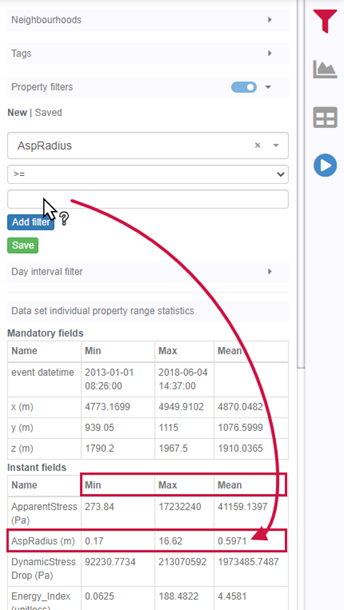
When querying from the Data set explorer or the Samples compilation and applying property filters to numeric properties, you can refer to the range of values in the table at the bottom of the query panel to see the minimum, maximum, and mean values of each property.
Previous tips can be found under the Software tip category in the News section and in the Archives section of our website.
Latest news

VPmg, VPem1D and VPutility release
VP Geophysics Suite releases: VPmg version 9.3, VPem1D version 4.3 and VPutility version 1.2...

Viewing data from report items
In Geoscience INTEGRATOR table and chart items from ad-hoc or scheduled reports can be easily refreshed, using the same filters that were applied in the original report, to display current data.

DC resistivity inversion in Geoscience ANALYST Pro Geophysics
Past event, view here or via our YouTube channel...

Python API live link
In Geoscience ANALYST you can enable a monitoring directory to instantly visualize and analyze the results...

Finding data sets by tags and neighbourhoods
In Geoscience INTEGRATOR, you can can lookup data sets by the tags they carry and the neighbourhoods they cover...

Uploading multiple files
In Geoscience INTEGRATOR, you can upload multiple files in one simple step...

Free mineral exploration data through Geoscience ANALYST
Past event - view here or on our YouTube channel...

Editing property’s colormap
In GOCAD Mining Suite, when you select a property its colormap can be edited...

Drillhole Statistics
In Geoscience ANALYST you can compute drillholes’ deviation statistics. These include...

Taskbar icons
In GOCAD Mining Suite, icons are added to the taskbar when you open windows such as another 3D Viewer or the 3D-GIS Query panel...

Getting started with the Python geoh5py
Past event, view here or via our YouTube channel...
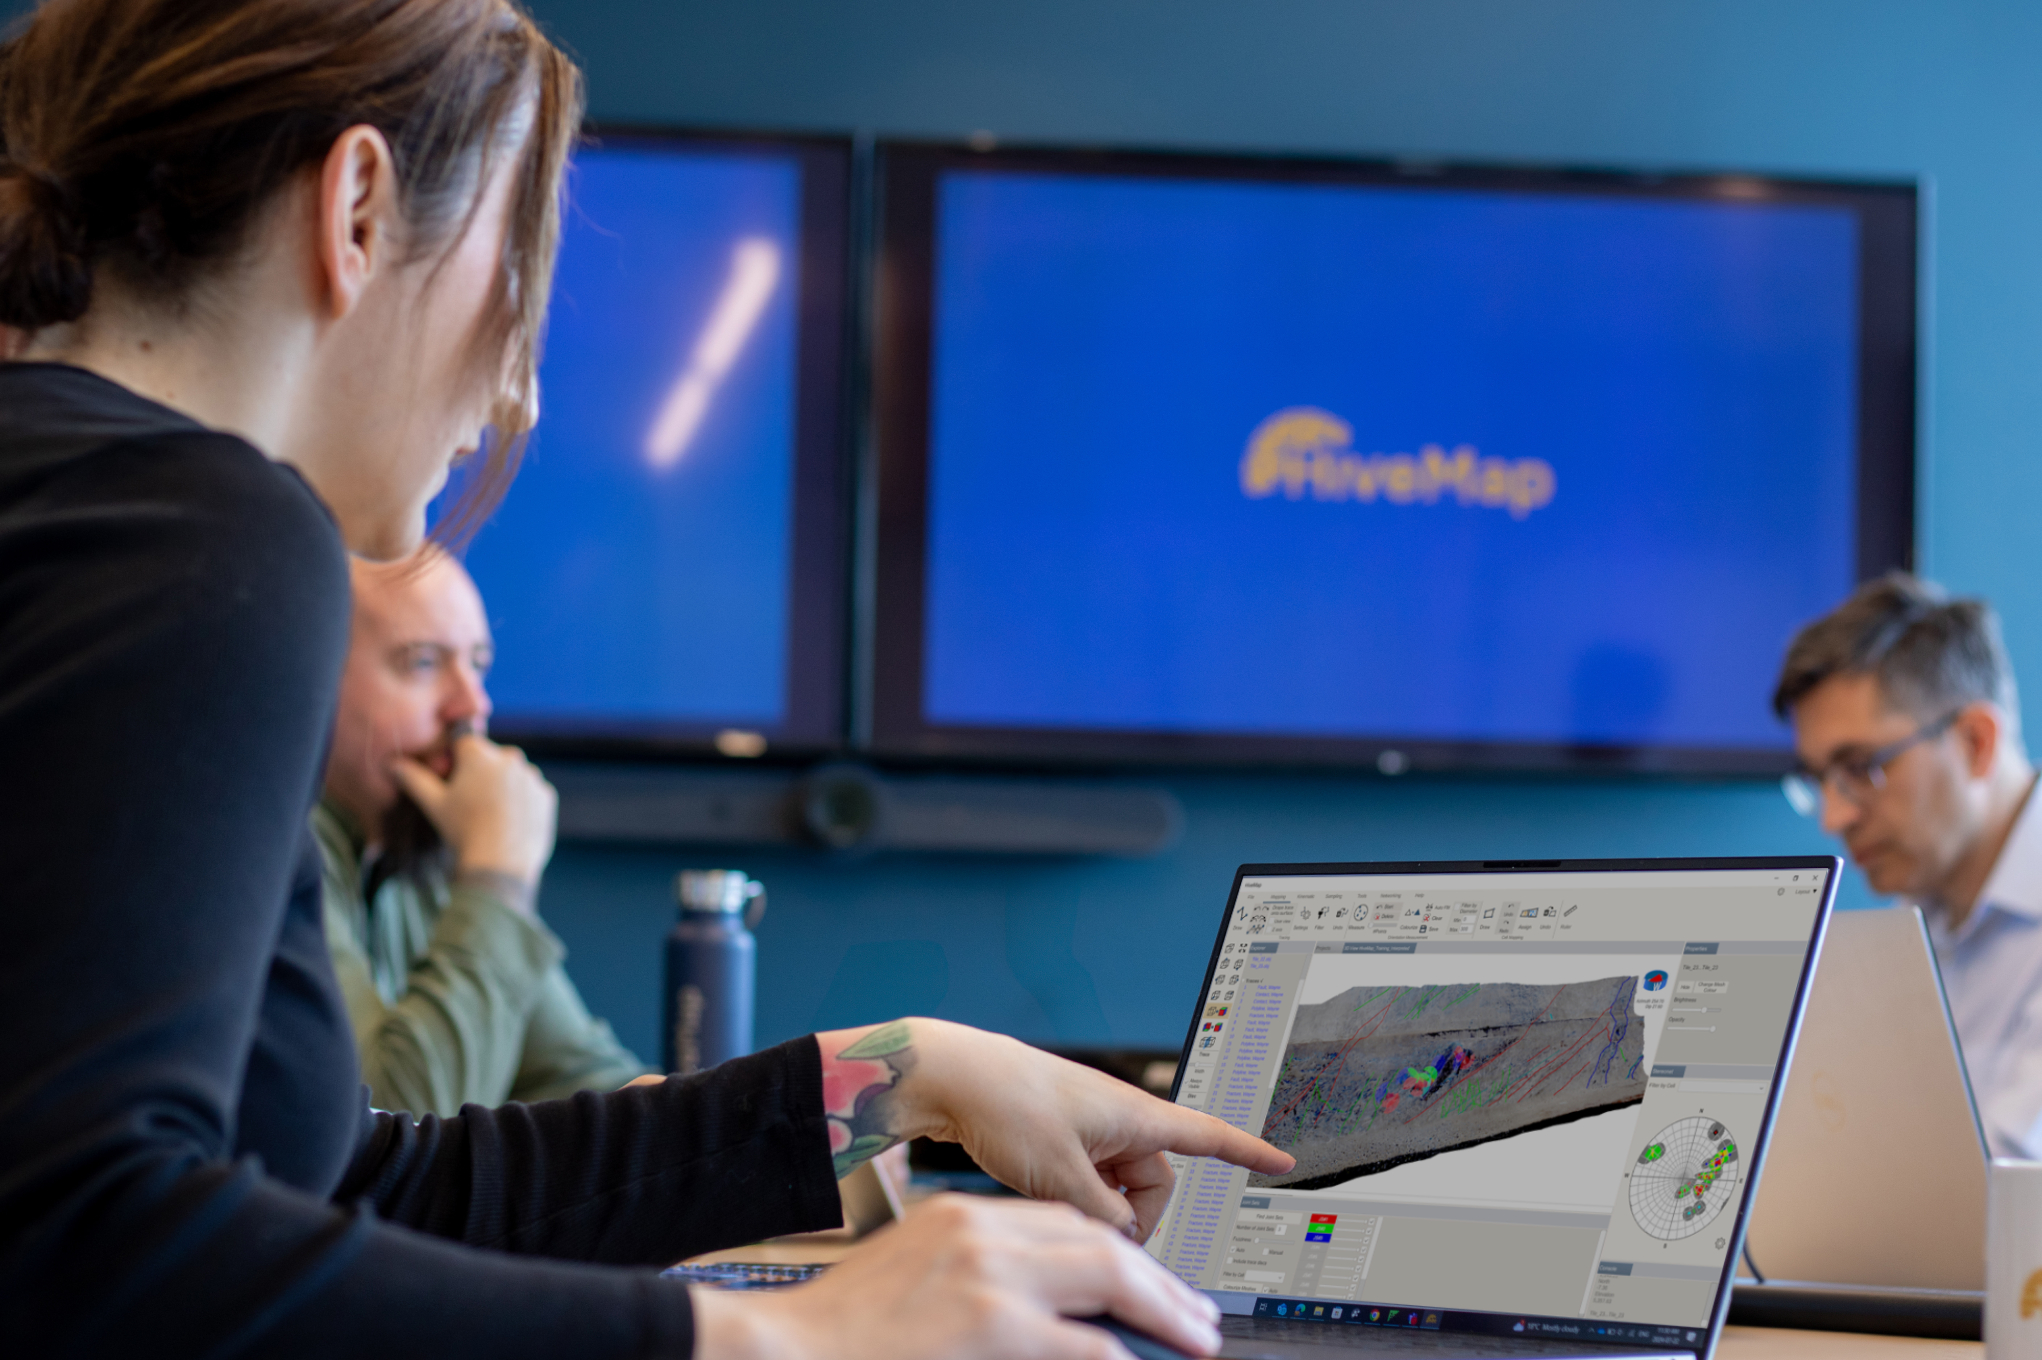
Introducing HiveMap
Capture geological observations quickly, safely, and accurately, both in the field and office with HiveMap...