


In the web UI, you can rapidly filter your data by neighbourhoods and display it in plots, charts, or tables.
Neighbourhoods are pre-defined volumes of space such as a level, a stope, a drive, or a shaft area. They can also be used to filter the data in the 3D viewer.

Previous tips can be found under the Software tip category in the News section and in the Archives section of our website.
Latest news

Getting started with the Python geoh5py
Past event, view here or via our YouTube channel...

Rock reclassification editor
In GOCAD Mining Suite, you can simplify logging codes for modelling projects and data management using the Rock reclassification editor...

Georeference images
In Geoscience ANALYST Pro you can georeference your geology maps and cross sections with...

Depth-to-basement inversion using geometry and homogeneous VPmg inversion
Past event - View here or on our YouTube channel...

Extending workflows with rapid model generation – Virtual Lecture
Past event - Shaun O'Connor showed how to use the built-in scripting tools for exploratory geological modelling with sparse data...

Rapid and accurate mapping
We explain how automated generation of alteration maps using radiometric data is well-suited to large-footprint mineral systems...

Filtering samples by their drillhole
In Geoscience INTEGRATOR, you can can filter them according to the drillhole they are located in...

Crustal scale gravity modelling and isostatic correction over central Chile
View recording - Thomas demonstrates how to apply an isostatic correction to gravity data through a case study over central Chile using...
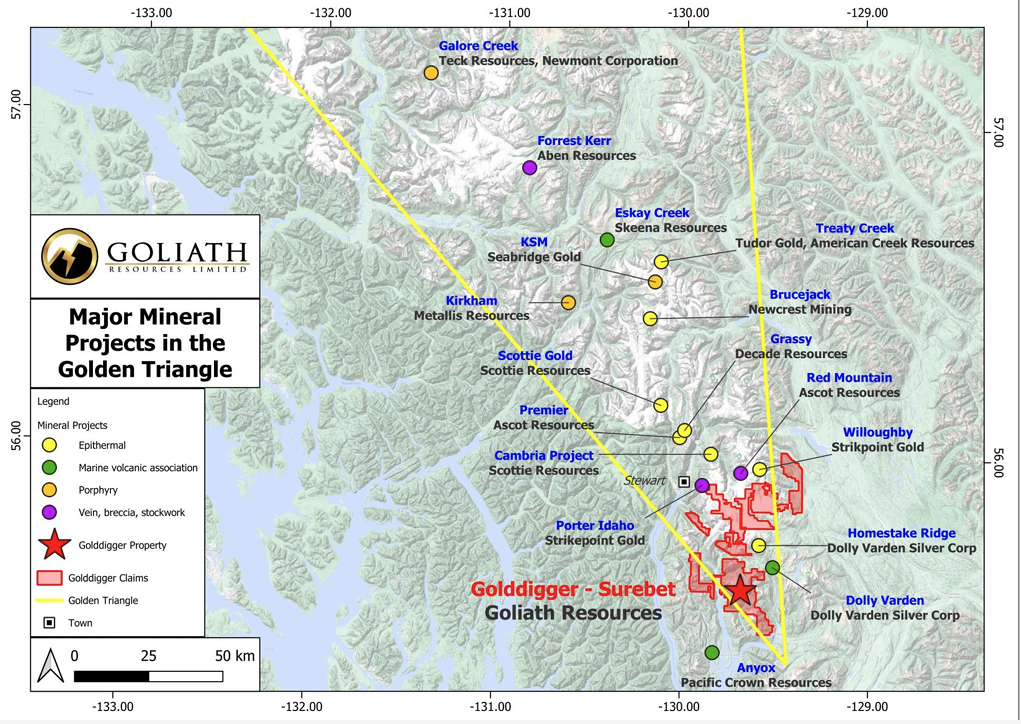
Remote Structural Mapping: A case study from the Golddigger property, BC
Capture geological observations quickly, safely, and accurately, both in the field and office with HiveMap...

New release – Geoscience INTEGRATOR 4.2
Geoscience INTEGRATOR 4.2 unveils a range of new features and improvements designed to boost performance and enhance user experience.

Automatic rotation
In Geoscience ANALYST you can autorotate viewport when presenting your 3D geoscientific data and models...

Q&A with VR Resources
Join us in this exciting conversation with Michael Gunning on how to find success in blue-sky exploration through integrated interpretation of magnetic data and structural geology