


The Data set explorer provides a simple, immediate ‘dashboard’ access to all the data sets and their summary information. Clicking on a data set summary box will provide additional info as well as access to explore deeper using filtering and charting tools.

Previous tips can be found under the Software tip category in the News section and in the Archives section of our website.
Latest news
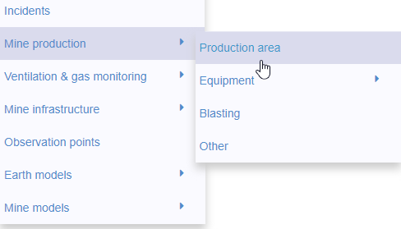
New mine production theme
In Geoscience INTEGRATOR, version 3.2 has a new theme called Production area. It’s designed for stope, mining room, or drawpoint data...

Adding reference images
You can add reference images to mine fusion models and hazard reports in Geoscience INTEGRATOR to better orient yourself visually.

New importer: 2D SEG-Y
In Geoscience ANALYST you can visualize your block model data by volume in the Visual Parameters panel...
..

New raster imports
In Geoscience ANALYST you can now import GeoTIFF (tif, tiff), ERMapper (ers), and Surfer (grd)...
..

Object’s Info
In GOCAD Mining Suite you can see how many nodes or triangles your Surface object consists of by right-clicking on...

Easily display a property on multiple objects
In GOCAD Mining Suite objects are grouped by the properties they contain...

Customized list of file types to help filtering your files
In Geoscience INTEGRATOR, on top of using Tags and Data set linking, you can give them a File type from a customizable list...

Data set search tools
In Geoscience INTEGRATOR, you can search by data set name or description through the Data set search...

Managing import templates
In Geoscience INTEGRATOR it is possible to edit Import template names and no-data values, activate/deactivate templates, see...

Deep Learning as an alternative to downward continuation filters for structural interpretation
Jean-Philippe Paiement proposes an alternative approach to the commonly used downward continuation filters used in the industry...

Effective date field
Geoscience INTEGRATOR v3.7 offers the Effective date upload field for files and maps...

A robust workflow for regional porphyry targeting; Application to the QUEST-South project area in southern British Columbia
Mitigating data science and statistical challenges is crucial to integrate machine learning into the everyday targeting tasks of exploration geologists.