



Now with Geoscience ANALYST 4.0 you can georeference your geology maps and cross sections with Geoscience ANALYST Pro by right-clicking on your Geoimage > Georeference to Landmarks.

Display multiple Viewports (Panels > Add Viewport) to make the georeferencing easier and faster!
Take a look at this video for a georeferencing demo.
Previous Geoscience ANALYST tips can be found under the Software tip category in our Resources page and in our Archives page.
Latest news

Filtering time-based data
In Geoscience INTEGRATOR, there are various ways to filter time-based data, by shirts, property, or even day intervals...
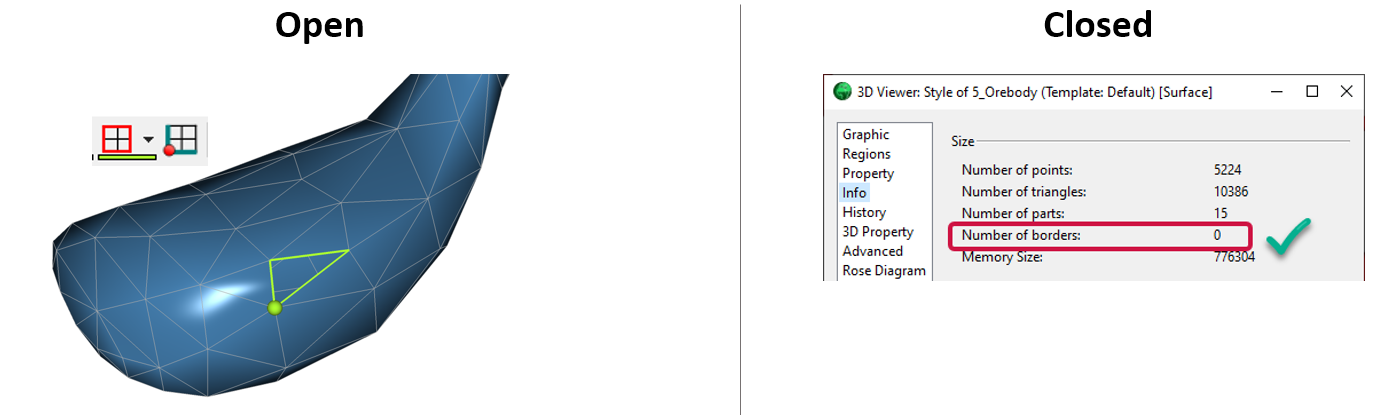
Is the surface opened or closed?
In GOCAD Mining Suite you can easily know if your surface is opened or closed by...

Peak finder – Geoscience ANALYST geoapps: Python application
Past event. Link to recording available here.

Customizing metadata
Version 3.0 of Geoscience INTEGRATOR has a new layout for data set summaries that allows you to document any general information as custom...

Managing import templates
In Geoscience INTEGRATOR it is possible to edit Import template names and no-data values, activate/deactivate templates, see...

GEOH5 open format
We developed geoh5 based on free and open-source HDF5 technology because of its many advantages: wide acceptance across numerous data-intensive industries...

R&D projects in data management
Over the past couple of years we have been developing skills and technology in practical, business-focused data management as a solid foundation for modelling, analysis, and interpretation.

Block model volume
In Geoscience ANALYST you can visualize your block model data by volume in the Visual Parameters panel...
..

3D seismic data and survey designer tools
Coming soon to Geoscience ANALYST, tools for hard rock seismic...

Improved data analysis
Analyze your data with enhanced histogram display options available in GOCAD Mining Suite v19...

Using predictive modelling in mineral exploration
We carried out targeting work for IOCG-style mineralisation in the Mt Dore area of QLD, Australia. We produced a 3D model and predictive exploration map...

Filtering samples by their drillhole
In Geoscience INTEGRATOR, you can can filter them according to the drillhole they are located in...