


At the core of this article, there are two simple questions:
1. Why Do We Map?
In earth sciences, all the questions we are trying to answer are based on a need to understand the earth’s surface and subsurface. We have a multitude of tools available from remote sensing and geophysics through to drilling that allows us to gather data points and gain insight into the earth’s subsurface. However, mapping exposures is the only approach we can take that allows us to clearly identify features at all scales, understand spatial and timing relationships, and have incontrovertible evidence to describe the geology. No other investigative system or tool can replace or replicate looking at exposures and seeing the geology for ourselves, which is where HiveMap steps in. HiveMap brings together digital tools for mapping in the field, as well as detailed analysis in the office.
2. What Is Mapping?
Mapping is the process of looking at the rocks AND recording what we see. Depending on our technical discipline, what we record, and the level of detail achieved can vary significantly. It is also important to understand that mapping involves recording both the locations of geological features, and their orientations. These are fundamentally different datasets, which are worked with in very different ways, but both must be recorded to properly support downstream analysis or modelling work.
Mapping is fundamental in geoscience because it transforms complex spatial data into clear, actionable insights that support everything from mineral exploration and environmental monitoring to hazard assessment and resource management.
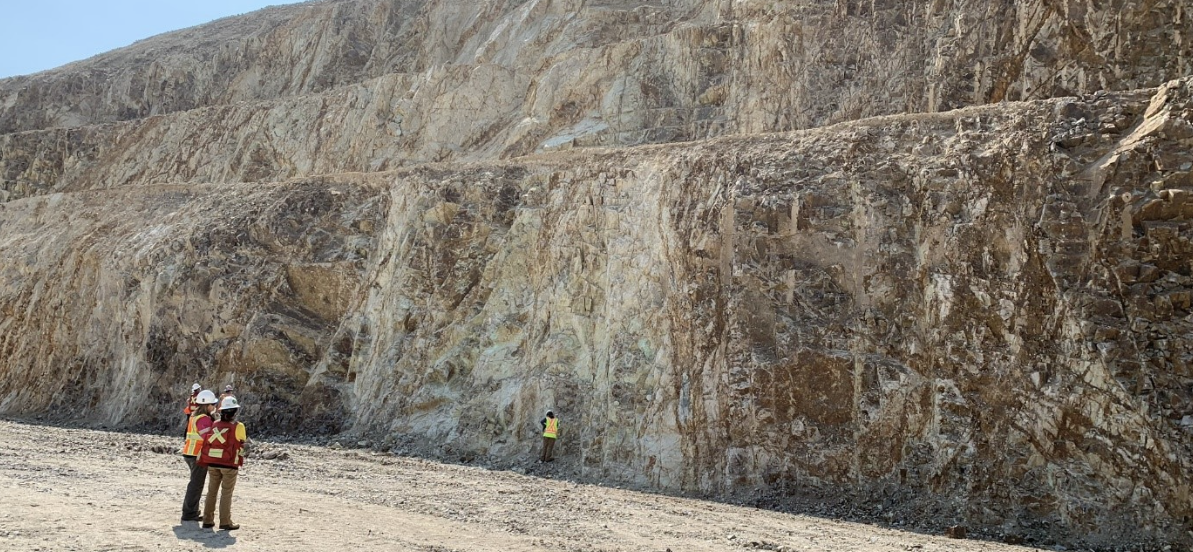
Geology Mapping for Grade Control
Collaboration tools are built directly into HiveMap, enabling all decision-makers to interact and discuss the geology and technical challenges in the same 3D space. Our goal is to break down the silos between disciplines and bridge the gap between sites and head offices, bringing everyone together to look at and discuss their projects and deposits in real-time.
Traditional approaches to mapping, and available geological mapping tools, often lead to different technical teams mapping using different tools, different approaches, and in the worst situations, mapping different datasets. This can rapidly lead to disconnects between observations, and a loss of trust in the observations gathered. HiveMap is designed to give all technical users access to the same high-quality datasets, make decisions in a single unified space, work together, and understand the development of the mapping dataset through time.
Mapping for Structural Geology
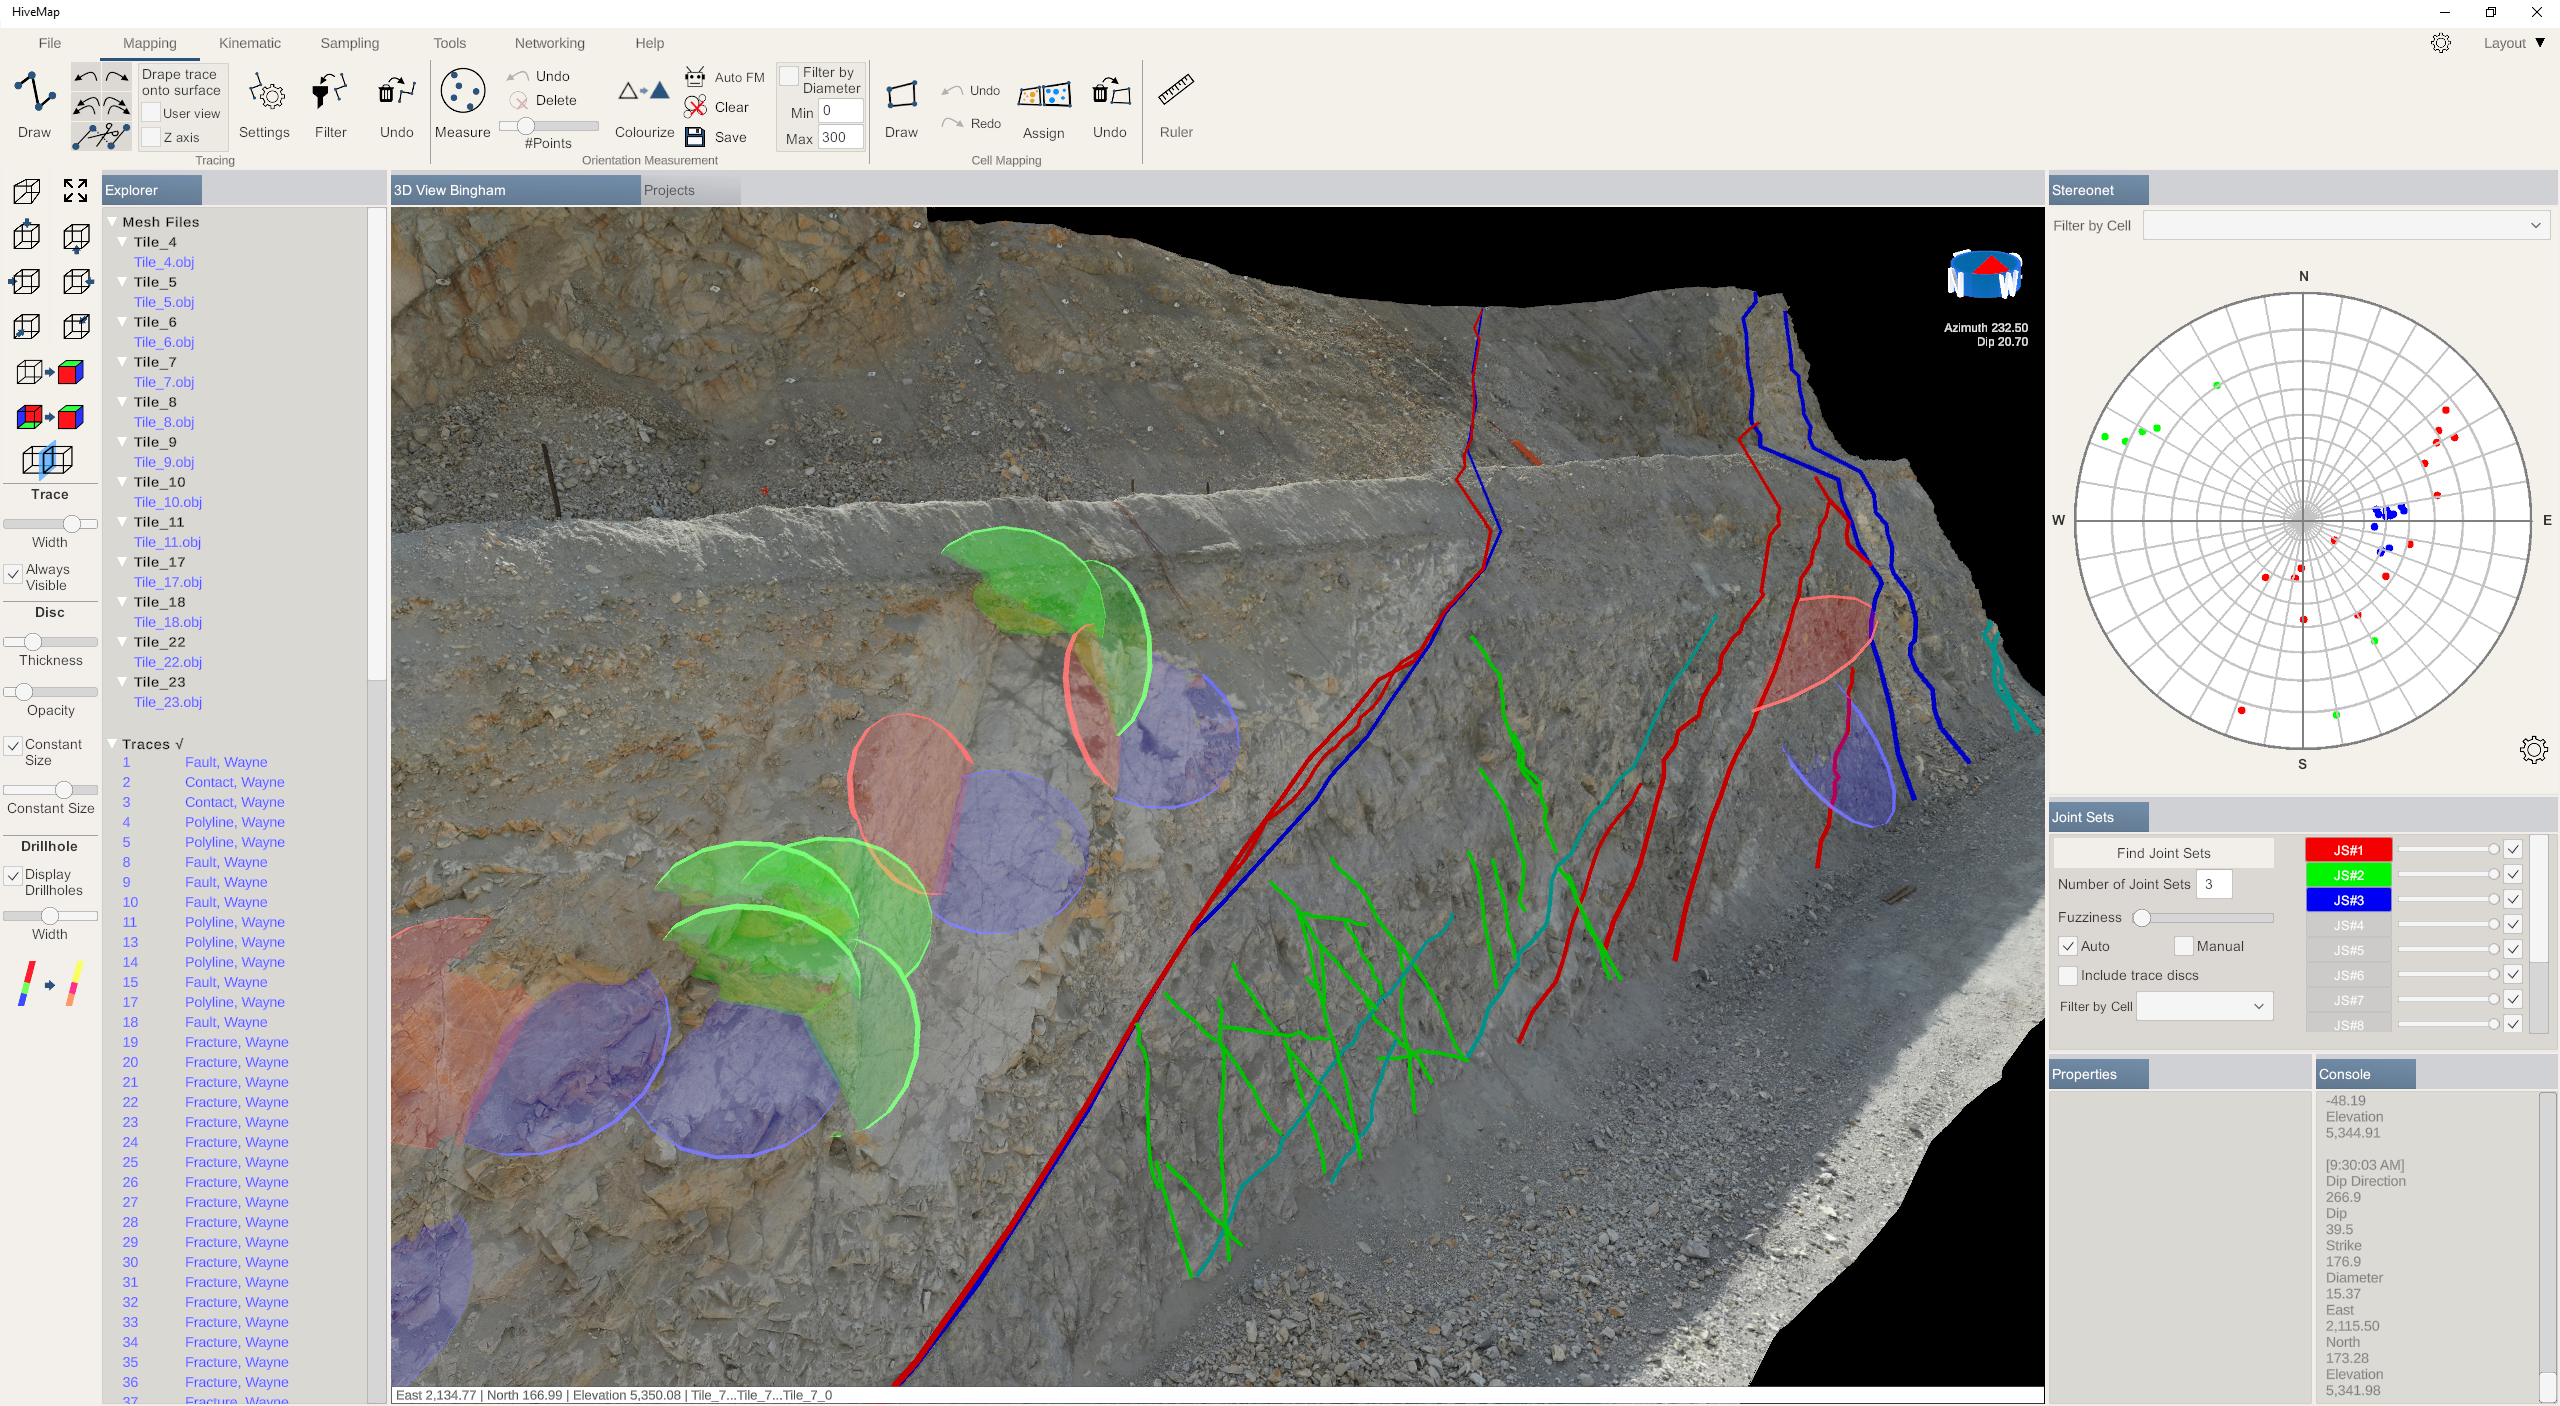
Structural geology focuses on understanding the deformation processes that have affected the geology of a given area and relies on accurate measurements of the orientation of different types of structures. Folding (or ductile deformation) can be defined by mapping out the orientation of bedding, foliation, or other rock fabrics. Results can then be analyzed using stereonets to understand the fold shapes, and the directionality we might expect to follow to find continuity in an ore deposit. Brittle deformation, or faulting, defines planes of damage along which the rock has moved. Mapping these faults and gathering large numbers of measurements at different scales allows structural geologists to define the patterns we expect to encounter as well as the orientation and continuity of individual features. A structural geologist mapping in HiveMap is able to rapidly draw in the visible fault networks at all scales, while simultaneously collecting oriented measurements. These two datasets together allow for efficient analysis of complex geological problems, and inclusion in structural models to represent the collected observations.
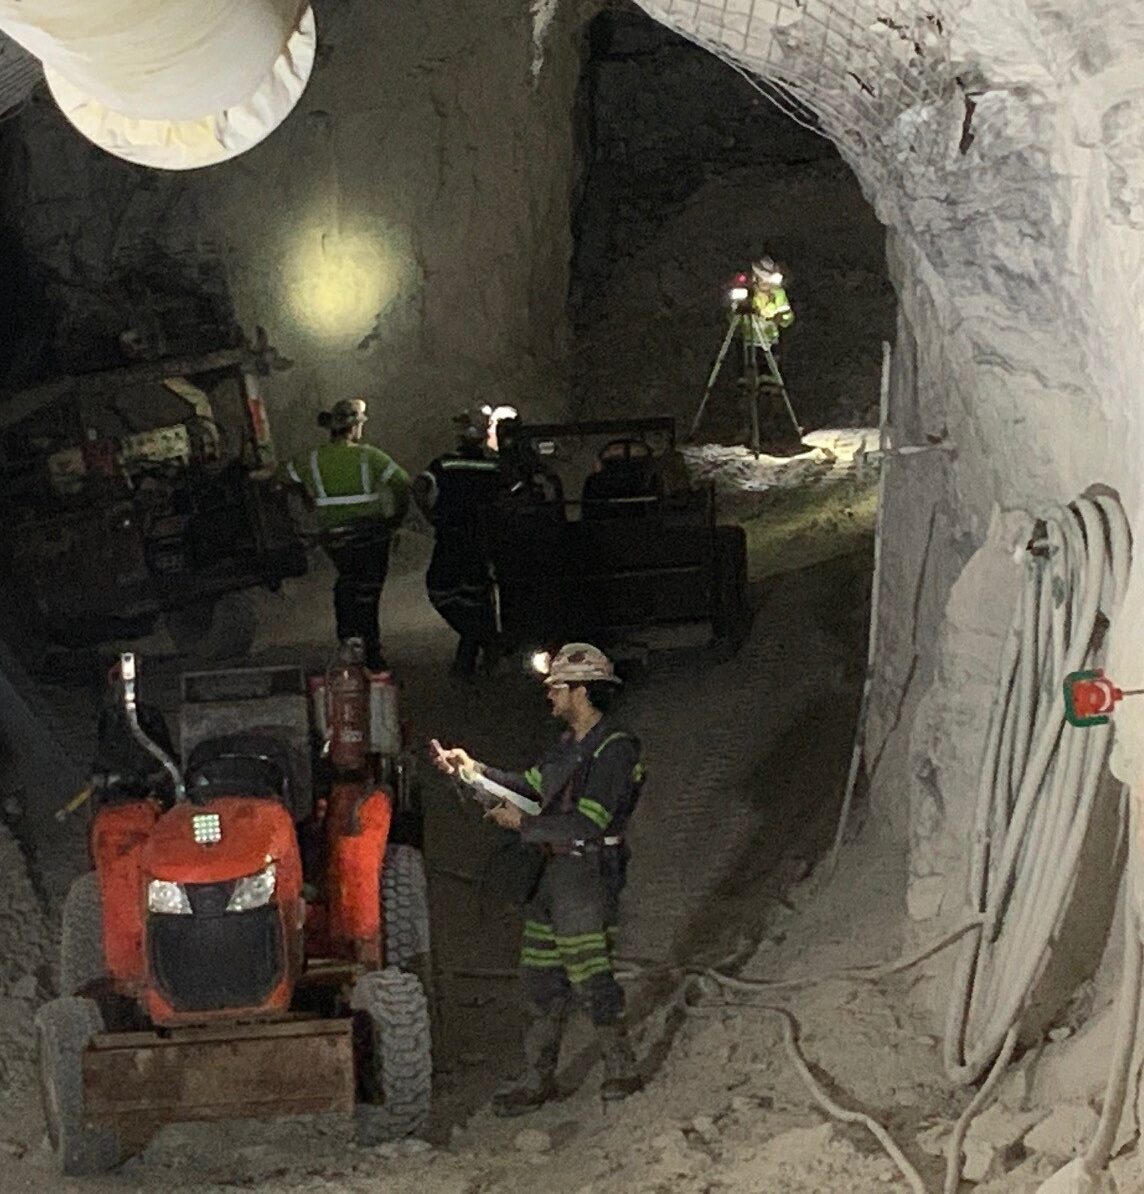
Mapping for Geotechnical Engineering
While geotechnical engineers use lithology and structural models built out by geologists, they also need to define the rock mass, or properties of the rock, in order to design underground and open pit workings. This involves developing an understanding of joint set populations and their spatial variability across a deposit. Detailed geotechnical analyses also require input on joint set spacing and the continuity of the joint sets. In some deposit cases, the orientation and variability of a dominant rock fabric (e.g. bedding or foliation) is an important geotechnical consideration. Field mapping or manual picking of these datasets is a laborious and time-consuming task. With some initial mapping of features, and then utilization of the stereonet tool in HiveMap, engineers can quickly identify different sets across the face to work with and start to make domain decisions based on changes to the variability of features. Features in HiveMap also include the ability to quantify statistical distributions in joint set spacing and persistence for the users and in further downstream engineering analyses.
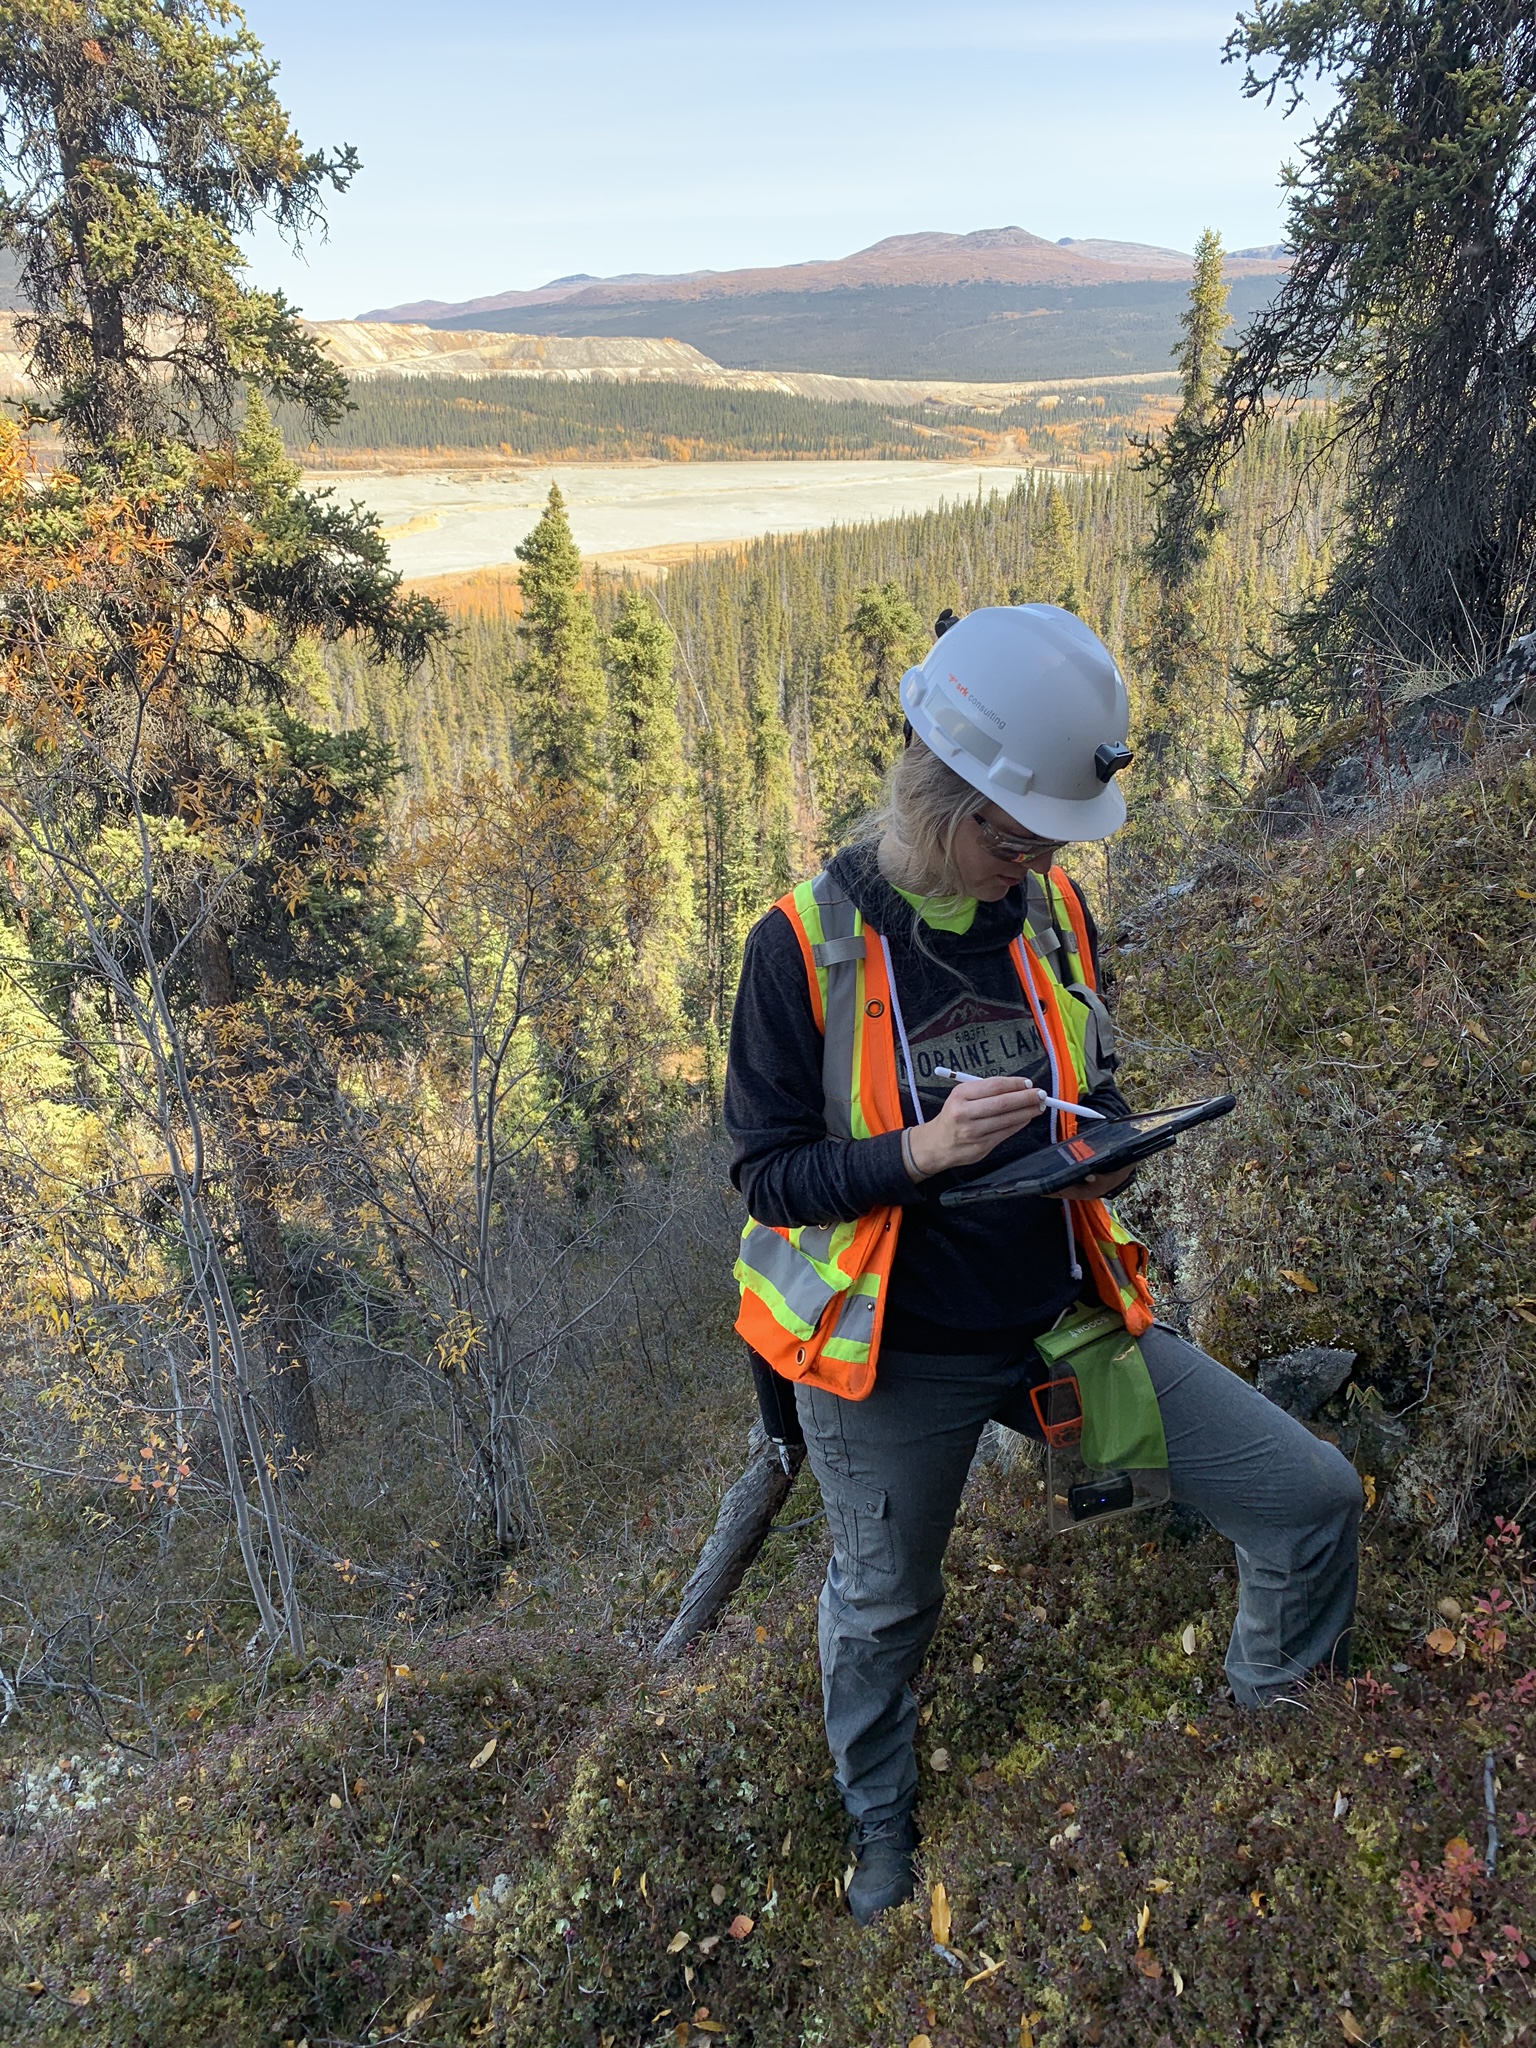
Mapping for Exploration Geology
The previous two roles are very much focused on what happens once an economic deposit has been identified and is either planned for production, or in production. But, geologists have a lot of work to do in order find a deposit! Exploration geologists conduct extensive surface mapping campaigns to identify prospective locations. Often times there may be extensive cover limiting the amount of available rock to map. In these situations, the maximum value needs to be extracted from any outcrop, with detailed mapping of structural patterns and relationships. Geologists can use modern tools to rapidly scan and create photogrammetry models of outcrops, and then use the tablet-based version of HiveMap to record their observations.
This can be supplemented by using HiveMap to step all the way back to the regional scale and do lineament analysis and digital mapping of the topography across the project. Geologists can use the patterns and relationships identified at the outcrop scale during field mapping to inform their interpretation at this larger scale to build an informed understanding of the sub-surface.
Mapping For Everyone
At the heart of all the technical earth science specializations is one thing: a requirement to make accurate and detailed observations of the rock exposure to make informed decisions or, to put it more simply, mapping!
The technical team behind HiveMap consists of experienced geologists and engineers who strongly believe that all modelling needs to be underpinned by powerful observational science. We wanted to create a tool that allowed everybody with the requirement to map to be able to do so quickly and easily, at the outcrop in the field, and where necessary, bring the outcrop into the office to increase our ability to map accurately, rapidly and across wide areas.

Please contact our team for additional information about our products and services
Latest news

GEOH5: A Framework for Geoscience Data and Model Portability

Mira Geoscience receives the 2023 AME Innovation Award

New release – Geoscience ANALYST 4.6

Machine learning in mineral exploration

Rock reclassification editor

EM101: Tips and tricks for EM data in Geoscience ANALYST

K-means clustering
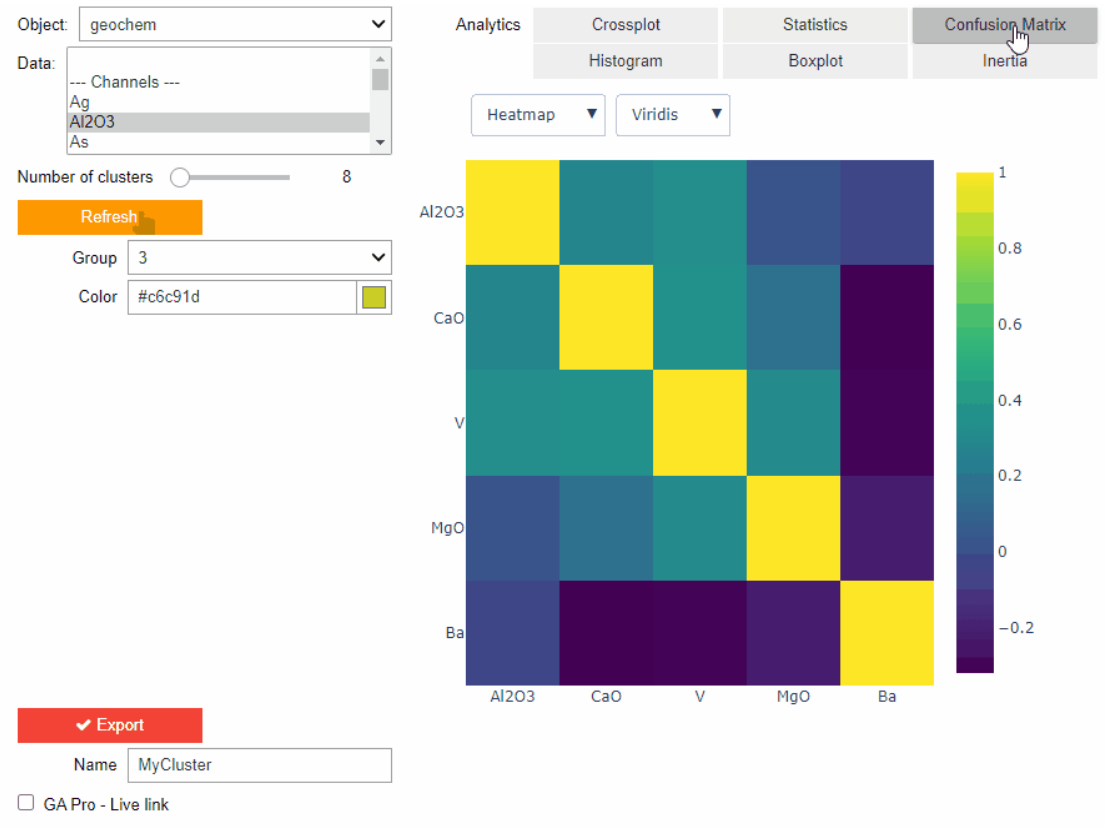
Clustering data stored on geoh5 objects
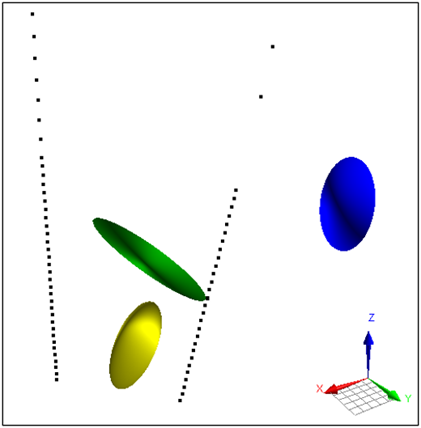
Parametric Ellipsoid Modelling in Geoscience ANALYST Pro Geophysics

Importing and preparing DC/IP data for inversion with Geoscience ANALYST – Virtual Lecture

Have you Scene this?
