


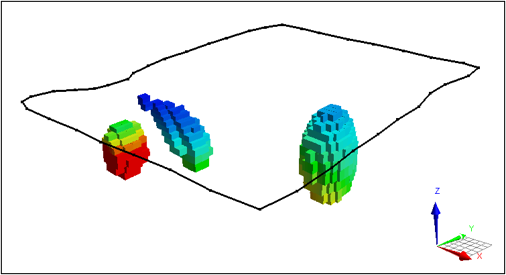
Quickly take snapshots of your Voxet sections using the snapshot tool. You can display images that show different properties of the same Voxet side-by-side to easily compare and review the model.
To access this tool, right-click on the Voxet > Tools > Snapshot Sections. You can view the images by opening the Images browser (Control menu ![]() > Reporting > Images).
> Reporting > Images).


The images are also exported to the project’s prj folder.
Previous tips can be found under the Software tip category in the News section and in the Archives section of our website.
Latest news

Documents linked to a project
When documents are linked to a project in Geoscience INTEGRATOR, it is possible to be more specific and link them to the project’s data sets...

Viewing data from report items
In Geoscience INTEGRATOR table and chart items from ad-hoc or scheduled reports can be easily refreshed, using the same filters that were applied in the original report, to display current data.

Earth model’s themes are renamed
In Geoscience INTEGRATOR v3.7, the “Earth models” theme group is renamed “Models, maps and sections” and the theme’s names were...

Block model volume
In Geoscience ANALYST you can visualize your block model data by volume in the Visual Parameters panel...
..

Québec Mining 2024
Explore the full interview that Scott Napier did for Québec Mining 2024
VPem3D in Geoscience ANALYST Pro Geophysics
Accelerating 3D TEM Interpretation with and without Geological Constraints. Read more >>

DC resistivity inversion in Geoscience ANALYST Pro Geophysics
Past event, view here or via our YouTube channel...
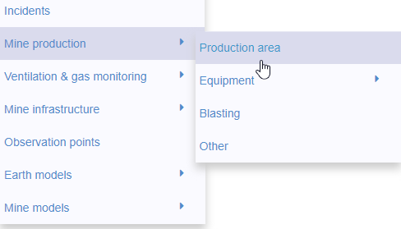
New mine production theme
In Geoscience INTEGRATOR, version 3.2 has a new theme called Production area. It’s designed for stope, mining room, or drawpoint data...

GEOH5: A Framework for Geoscience Data and Model Portability
Used by thousands, GEOH5 is the open-source data structure that is taking down the interoperability barriers and revolutionizing...

The value of using structural restoration tools in exploration modelling – Virtual Lecture
Watch recording - Jean-Philippe shows the use of structural restoration tools in GMS as a modelling tool for structurally controlled deposits...

R&D projects in data management
Over the past couple of years we have been developing skills and technology in practical, business-focused data management as a solid foundation for modelling, analysis, and interpretation.

Creating 3D geological starting model from geological maps and structural measurements
In this lecture, Philippe generates a 3D geological model from a map with structural measurements in Geoscience ANALYST...