


Since version 3.5, you can increase/decrease the node size, take snapshots, zoom in on an area of interest, and display spike lines. Various colour scales were added to better suit your data.
Performance-wise, scatter plots now support an unlimited number of points and tooltips now support up to 300,000 labels.

Previous tips can be found under the Software tip category in the News section and in the Archives section of our website.
Latest news

Linking viewports
In Geoscience ANALYST you can synchronize the perspective of all visible Viewports to zoom, pan, and rotate them all at once...

Quick selection search tool
In Geoscience INTEGRATOR we added a search box to help you find objects lists such as drillholes, samples, or stations that often have thousands of items...

Q&A with VR Resources
Join us in this exciting conversation with Michael Gunning on how to find success in blue-sky exploration through integrated interpretation of magnetic data and structural geology

UDMN Award of Excellence
Geoscience INTEGRATOR wins - Last December, UDMN presented us with an Outstanding Achievement in Commercialization...

Search for Objects – find anything, anywhere, anytime
In GOCAD Mining Suite find any objects you're looking for in no time...

Digital Mapping, The Future!
Capture geological observations quickly, safely, and accurately, both in the field and office with HiveMap...

A robust workflow for regional porphyry targeting; Application to the QUEST-South project area in southern British Columbia
Mitigating data science and statistical challenges is crucial to integrate machine learning into the everyday targeting tasks of exploration geologists.

Effective date field
Geoscience INTEGRATOR v3.7 offers the Effective date upload field for files and maps...

New Visual Parameter – Contours
In Geoscience ANALYST you can visualize contours on 2D grids. Select your data, specify the contour parameters, or change the colour.
..

K-means clustering
In Geoscience ANALYST Pro’s v3.3, you can quickly partition your data based on the K-means clustering...

Using Python with Geoscience ANALYST
A new Geoscience ANALYST Python API, providing the capability of connecting to open source software, is scheduled for release....
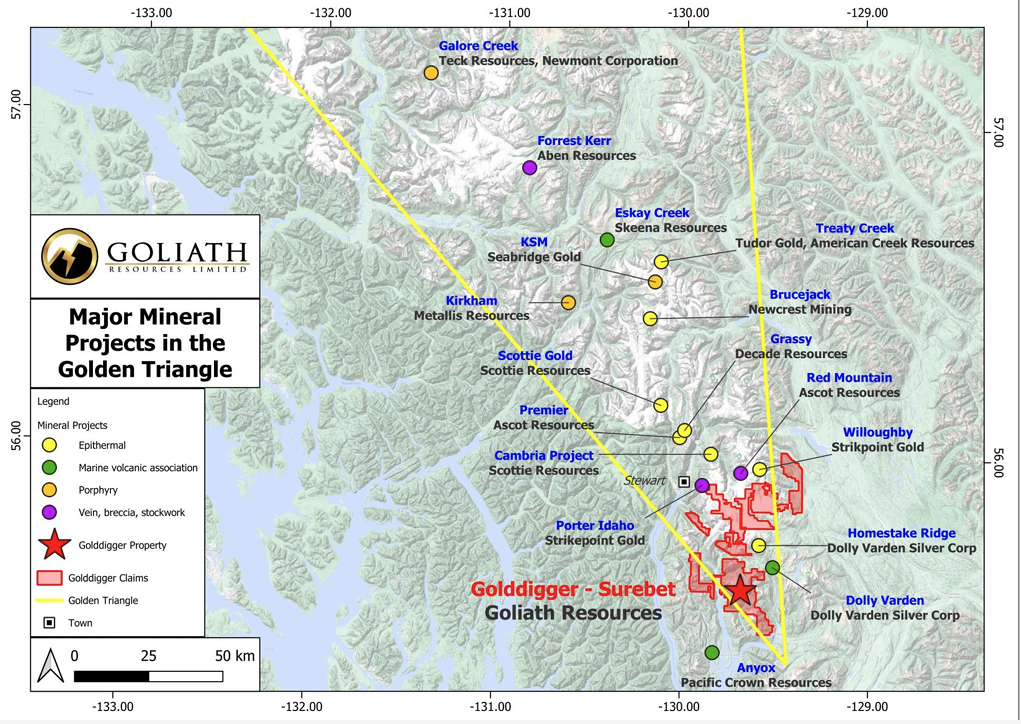
Remote Structural Mapping: A case study from the Golddigger property, BC
Capture geological observations quickly, safely, and accurately, both in the field and office with HiveMap...