


The K-means clustering utility includes the ability to compute the data’s inertia curve. This helps you choose the number of clusters by measuring how well the data set was clustered by the K-means algorithm.

Previous tips can be found under the Software tip category in our Resources page and in our Archives page.
Latest news

Effective date field
Geoscience INTEGRATOR v3.7 offers the Effective date upload field for files and maps...

GOCAD Mining Suite – A geological modelling powerhouse
Past event, recording link available here...
Revolutionizing Subsurface Interpretation and 3D Visualization with Geoscience ANALYST Pro
Discover how EnBW is bridging the gap between 2D mapping, 3D seismic interpretation, and integrated geophysical workflows

Using comment field entries in drillhole databases to automatically re-log lithologies
This approach uses the comment field of the logging table to extract general topics that can then be used as learning features in a supervised machine learning classification approach.

Let the data speak!
Four years ago, along with DMT Group, we started working with JSC Apatit on their Kirovski and Rasvumchorr mines that...

Attending PDAC 2026?
Visit us at booth 814 to see our software solutions in action and discuss your needs with our expert team!

Peak finder – Geoscience ANALYST geoapps: Python application
Past event. Link to recording available here.

How to run gravity inversions in a geologically driven way
Past event, view here or on our YouTube Channel to see how to run a 3D inversion and forward modelling in Geoscience ANALYST Pro using VPmg...
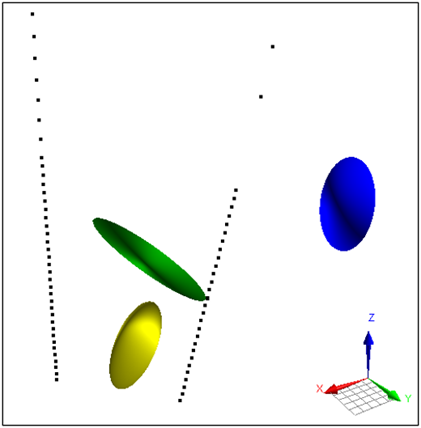
Parametric Ellipsoid Modelling in Geoscience ANALYST Pro Geophysics
A Fast New Way to Interpret TEM Anomalies. Read more >>

Advanced drillhole planning and monitoring
We partnered with Groupe MISA to develop a low-cost 3D application where all elements of drillhole design and monitoring...

Linking cursors
In Geoscience ANALYST you can use the Link Cursors button to helps to track the location of your cursor across multiple Viewports...

New clustering application in geoapps
geoapps - Exploratory Data Analysis (EDA), rock classification generation, or map alteration footprints