


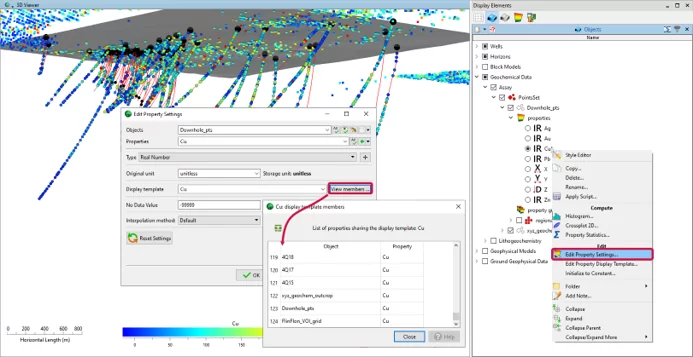
The display template is used to group properties that share the same display styles such as colormap, high clip, low clip, and transparency.
When a property is created, a default display template is generated for the property name. Any subsequent property created with the same name on another object will have the same display template. Changes made to the property’s style will be reflected on all the properties sharing display templates.
- To view or edit display settings, right-click on the property and select Style Editor
- To view the objects sharing the same display template, right-click on the property, select Edit Property Settings > View Members
- To remove a property from a display template, simply enter a new display template in the Edit Property Settings dialog box
Previous tips can be found under the Software tip category in the News section and in the Archives section of our website.
Latest news

Inverting time domain data in Geoscience ANALYST version 4.0 – Virtual Lecture
Kristofer inverts TEM data in 1D through Geoscience ANALYST Pro Geophysics to recover conductivity in Geoscience ANALYST 4.0...

Women Geoscientists in Canada
We are proud sponsors of WGC, advocates for increased gender balance within geosciences...

Remote Structural Mapping: A case study from the Golddigger property, BC
Capture geological observations quickly, safely, and accurately, both in the field and office with HiveMap...
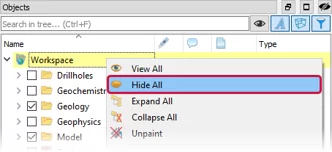
Show and hide
In Geoscience ANALYST you can show and hide everything, individual objects, container groups or drillhole groups...

Sneak peek v19
Emerson-Paradigm released a short video to help users become acquainted with the redesigned interface. Watch this short video ...

K-means clustering: compute inertia curve
In Geoscience ANALYST Pro the K-means clustering utility includes the ability to compute the data’s inertia curve...
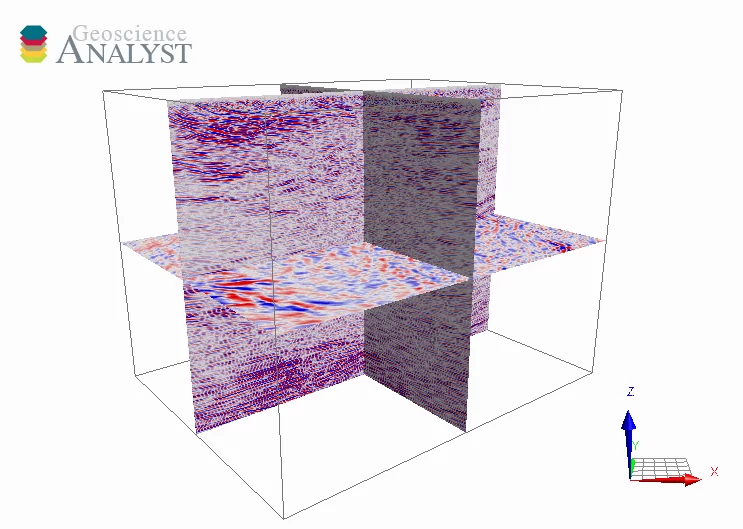
3D seismic data and survey designer tools
Coming soon to Geoscience ANALYST, tools for hard rock seismic...
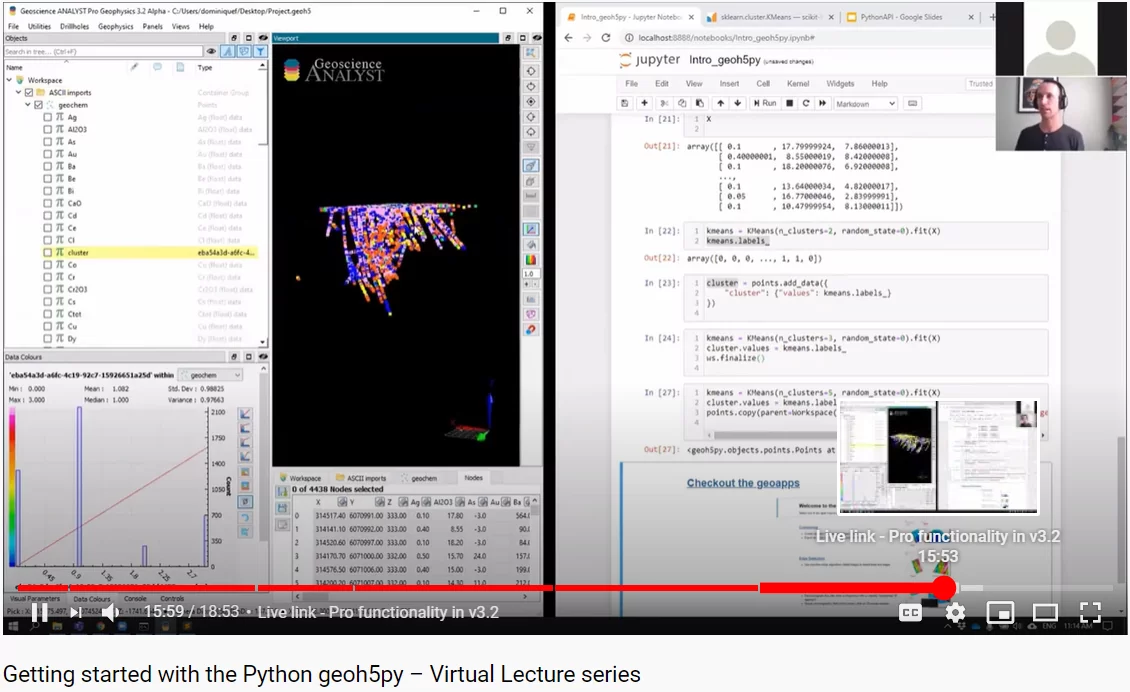
Python applications for geoscientific problems
geoh5py and geoapps - Open format, open source code, and open licensed data! Cannot get any better than that!

Parametric Ellipsoid Modelling in Geoscience ANALYST Pro Geophysics
A Fast New Way to Interpret TEM Anomalies. Read more >>
Python API live link
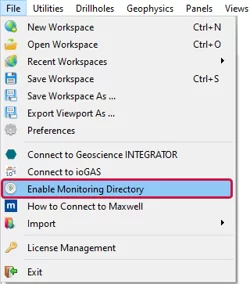
In Geoscience ANALYST you can enable a monitoring directory to instantly visualize and analyze the results...

Digital Mapping, The Future!
Capture geological observations quickly, safely, and accurately, both in the field and office with HiveMap...

A YouTube Channel about 3D modelling
We have quite a few how-to and tutorial videos lined up on YouTube highlighting our earth modelling, interpretation, and data management software for the construction of plausible geological models.