
Coffee break… and learn!
Available on our YouTube channel

In this lecture, Dominique Fournier showed the Peak Finder geoapp for the detection and grouping of time-domain electromagnetic (TEM) anomalies measured along flight lines. Anomaly markers can be exported to Geoscience ANALYST, along with various metrics for characterization and targeting. This application can also be used for the characterization of anomalies of mixed data types (e.g., magnetics, gravity, topography).

This episode is available on our YouTube channel. More details about this series can be found on our Events page or join the mailing list.

Dominique is a Scientific Programmer who complete his PhD in geophysics at the University of British Columbia with a focus on advanced magnetic vector inversion for greenfeld exploration projects. He was a member of our project consulting team prior to acquiring extensive experience in the development of software for non-linear inverse problems, data integration and clustering, and geological interpretation at UBC. His experience and academic profile provide an ideal background to continue development of our geophysical software. Dominique is based in Vancouver.

Latest events and news
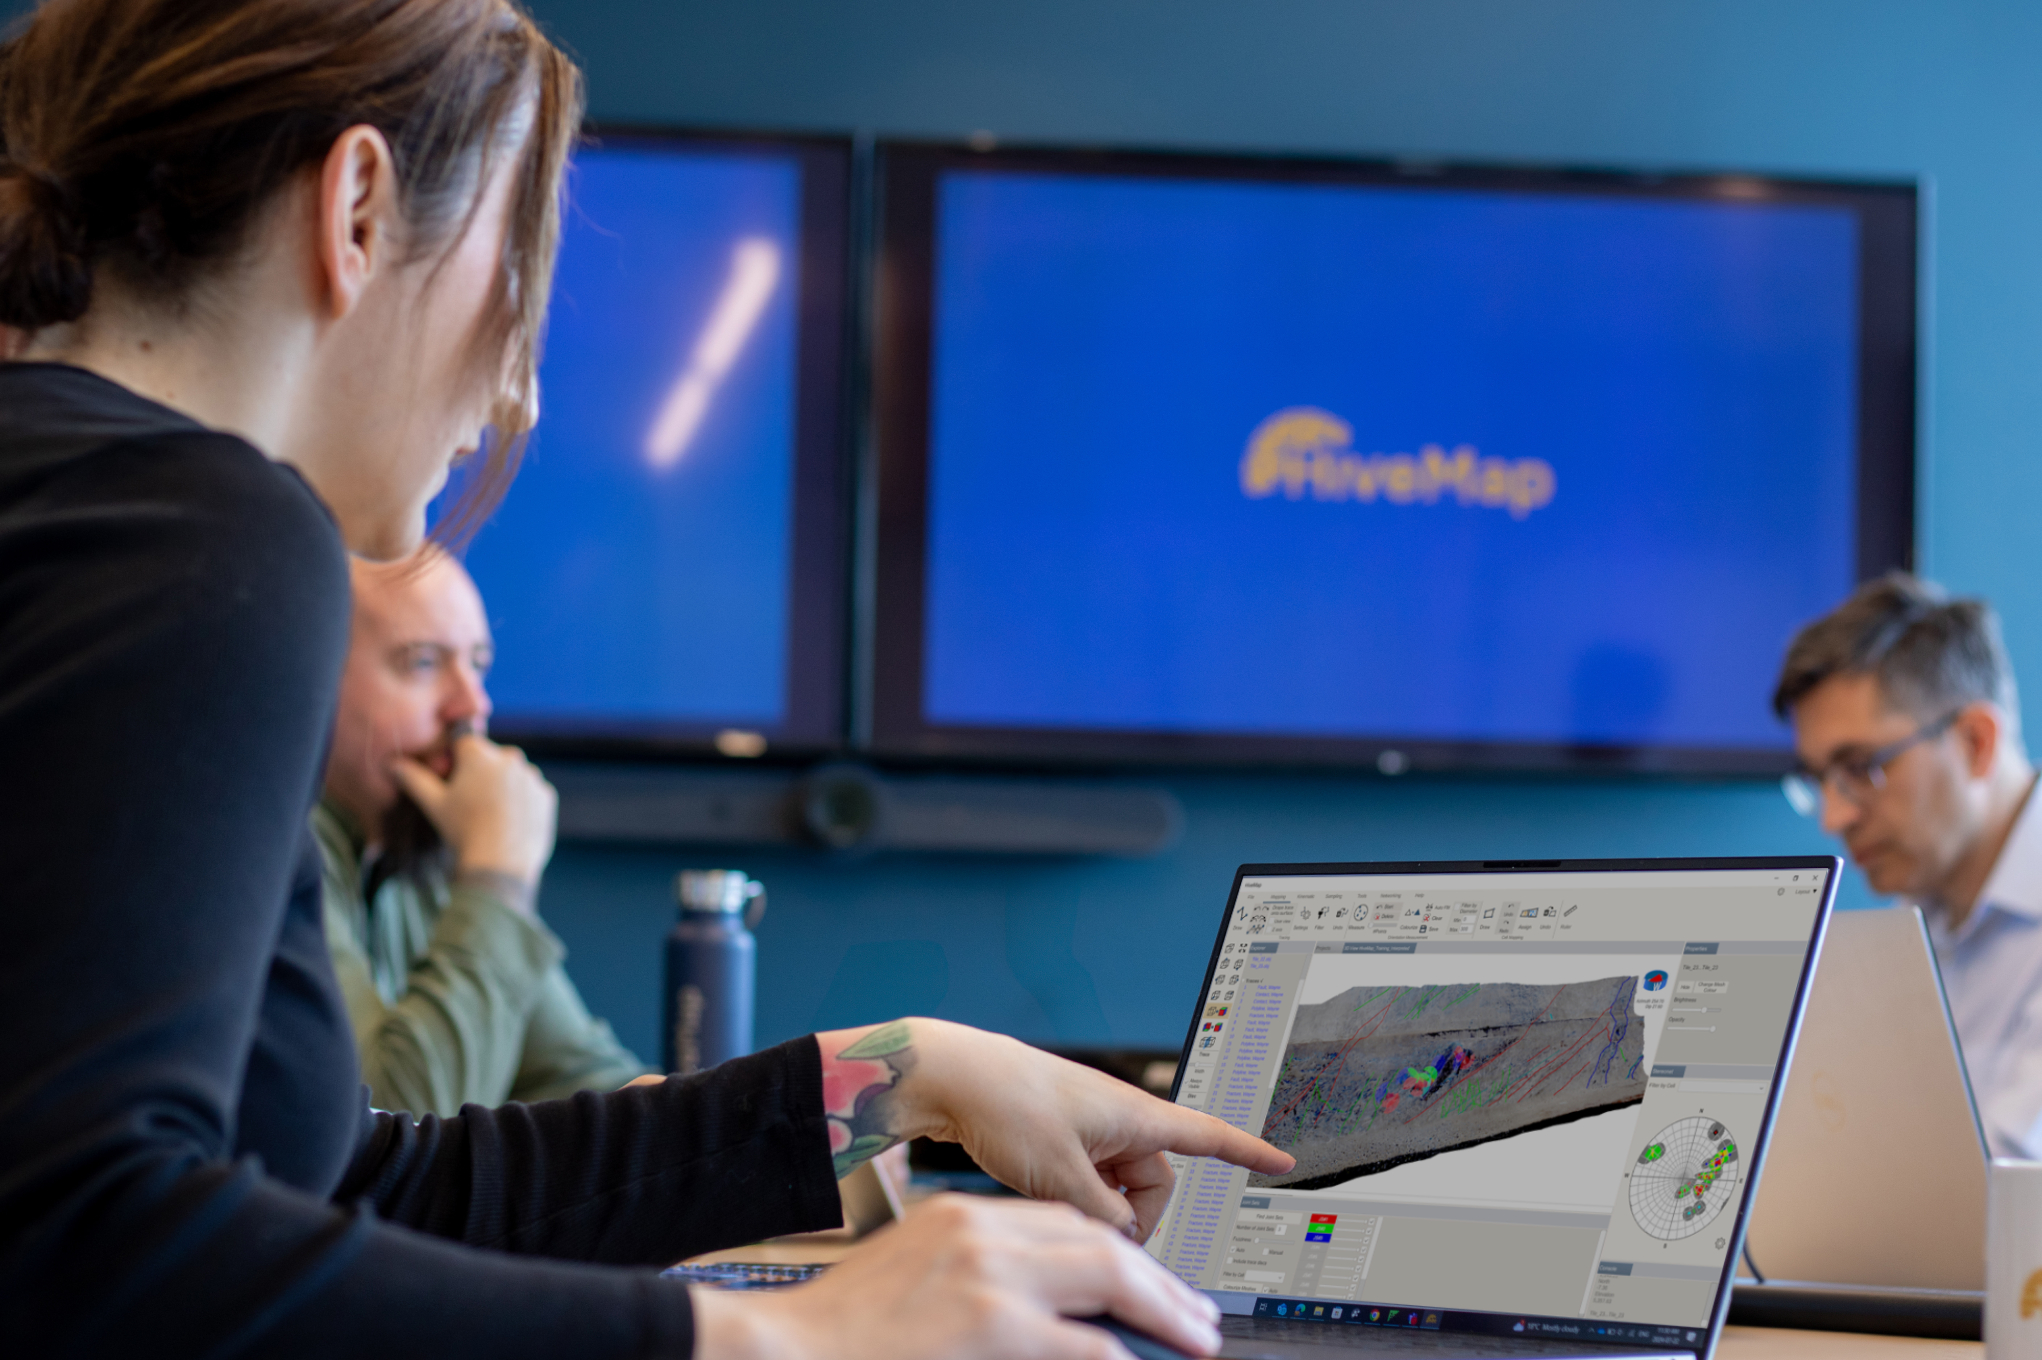
Case studies
March, 29 2015

Using predictive modelling in mineral exploration

We carried out targeting work for IOCG-style mineralisation in the Mt Dore area of QLD, Australia. We produced a 3D model and predictive exploration map...
Read more
December, 16 2019

Search for data by spatial extent

This video shows you how to search for data from Geoscience INTEGRATOR by spatial extent...
Read more
July, 05 2022

Object’s Info

In GOCAD Mining Suite you can see how many nodes or triangles your Surface object consists of by right-clicking on...
Read more
HiveMap
January, 21 2026

Digital Mapping, The Future!

Capture geological observations quickly, safely, and accurately, both in the field and office with HiveMap...
Read more
April, 01 2022

K-means clustering: compute inertia curve

In Geoscience ANALYST Pro the K-means clustering utility includes the ability to compute the data’s inertia curve...
Read more
January, 05 2021

Copying drillholes in a grid pattern

In Geoscience ANALYST you can copy an existing drillhole’s collar and deviation in a grid pattern to map a mineralized horizon...
Read more
April, 13 2020

Quick selection search tool

In Geoscience INTEGRATOR we added a search box to help you find objects lists such as drillholes, samples, or stations that often have thousands of items...
Read more
August, 03 2020

Have you Scene this?

In GOCAD Mining Suite v19, you can save the view as a Scene by right-clicking on the 3D Viewer > (Scene) Save As…
Read more
September, 13 2021

Find and Replace

In GOCAD Mining Suite find and replace any objects you're looking for in no time...
Read more
Mineral systems interpretation and targeting
July, 13 2022

Generating exploration models from a detailed structural interpretation and Artificial Intelligence

This approach uses the comment field of the logging table to extract general topics that can then be used as learning features in a supervised machine learning classification approach.
Read more
Case studies
September, 15 2025

Revolutionizing Subsurface Interpretation and 3D Visualization with Geoscience ANALYST Pro

Discover how EnBW is bridging the gap between 2D mapping, 3D seismic interpretation, and integrated geophysical workflows
Read more
March, 09 2021

Improved scatter plots

In Geoscience INTEGRATOR, you can can increase/decrease the node size, take snapshots, zoom in on an area of interest...
Read more

Please contact our team for additional information about our products and services