4D data integration and geohazard assessment
Data-driven analytics tells us directly how data and models correlate to mining geohazards and how they can be combined into the most effective probabilistic hazard assessment. We use predictive analytics methods to examine the 4D state of the mine over time and compare it to the history of experienced hazards. We rigorously explore the relationships to define a quantitative, data-driven hazard model to forecast future hazard.
Hazards are treated as a 4D function of time and space on the rock interfaces where they are experienced. We typically work with a few dozen static and time-dependent candidate hazard criteria, modelled throughout the mine. Our Geoscience INTEGRATOR platform automatically computes collocated properties (in time and space) that can be quantitatively interrogated or compiled for machine learning applications, such as rockburst or other geohazard assessment. It automatically computes hazard forecasts and report results to stakeholders.

© 2016 JSC Apatit. All rights reserved
Four years ago, along with DMT Group, we started working with JSC Apatit on their Kirovski and Rasvumchorr mines that have severe geotechnical challenges in protecting personnel, equipment, and production. The mines are in the Khibiny mountain complex— the largest alkaline intrusion in the world. The orebodies’ shapes primarily follow the circumference of the mountains with complex bulges and folding. Stresses are a significant geotechnical concern; in particular, horizontal stresses are much higher than vertical ones, sometimes by a factor of ten. The area is also known for its high seismicity and numerous faults.
To support the mines’ ongoing safety efforts, a Geoscience INTEGRATOR system has been installed on site. It consists mainly of 4D data management and geohazard calculation components. It automatically computes site-specific rock- burst hazard probability in all the mines’ drifts, daily. We used a data-driven, predictive analytics approach to develop the site-specific rockburst assessment, establishing quantitative, statistical relationships among a diverse, integrated array of 4D input hazard criteria and the history of damage at the mines.

Caption: 3D model of the high seismicity and numerous faults; geotechnical challenges at JSC Apatit.
© 2019 Mira Geoscience Limited. All rights reserved
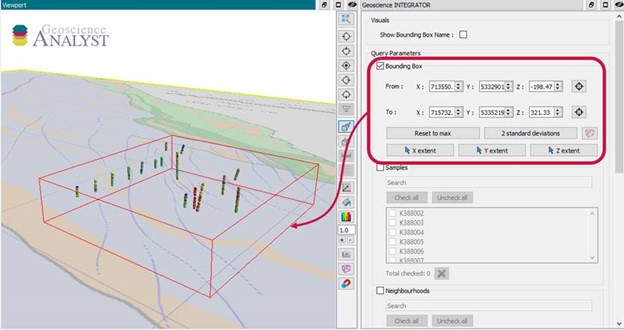
To do so, in discussion with site experts, we established a list of all criteria that were believed to have possible correlations with the experienced rockbursts. Then we assembled the necessary 2D, 3D, and 4D data based on mine development, rock environment and structural characteristics, stress models, seismicity, and blasting. A series of 3D models of the mine were built in GOCAD Mining Suite to represent the state of the mine at the time of each historical rockburst event. The snapshots in time were combined in a ‘data fusion’ step, which collocates the spatial and time-based properties to a single set of points representing the mine drifts. Finally, we ran a probabilistic back-analysis study, providing an integrated hazard assessment formula that combines weighted rules based on geology, seismicity, stress, production, and mine geometry.
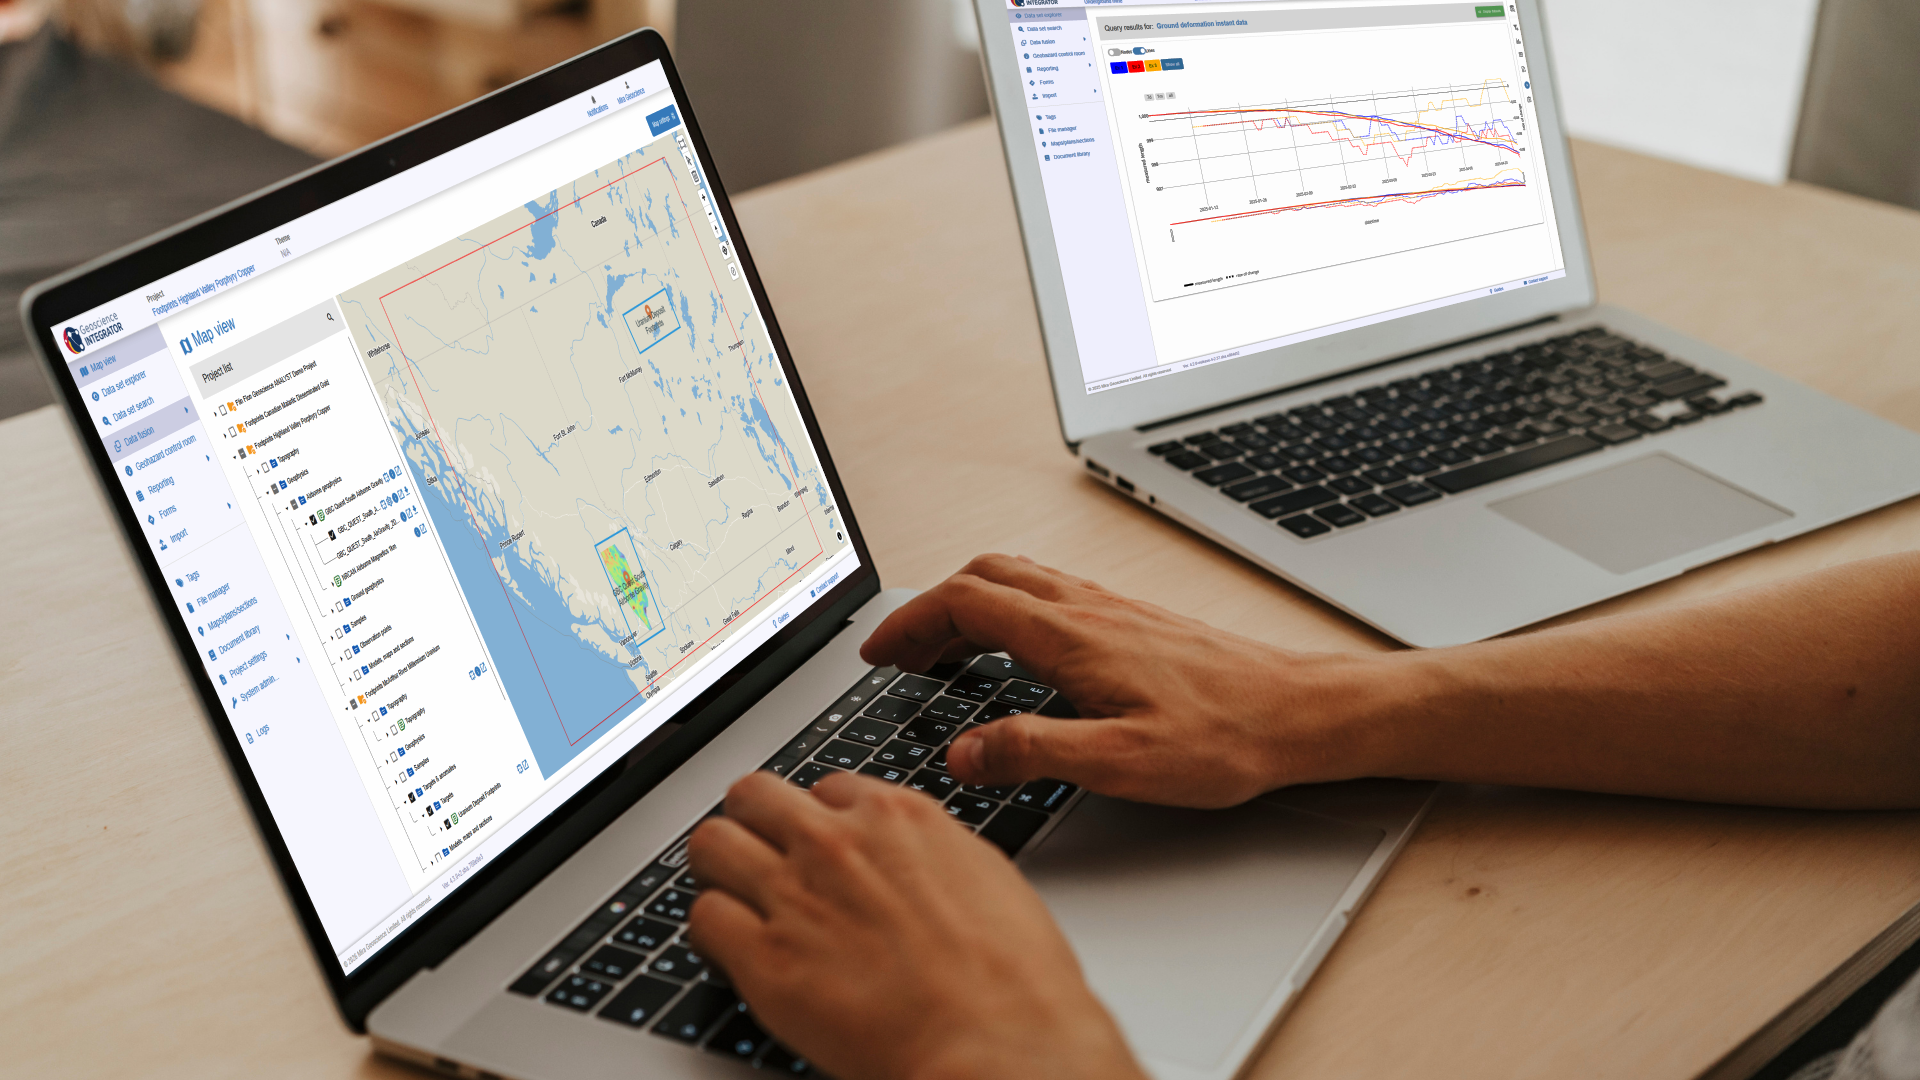
Running the hazard calculations on new data automatically imported into the system provides an updated rockburst probability assessment for the mine. Without any required user interaction, the system continuously updates the individual hazard criteria on the mines’ drifts, runs the hazard calculations, and sends geohazard reports by email to the engineers at the company’s Rockburst Prevention Centre.

Caption: Geoscience INTEGRATOR automatically computes site-specific rockburst hazard probability in all the mines’ drifts, daily. Each time the hazard index is calculated, a report is sent to stakeholders by email.
© 2019 Mira Geoscience Limited. All rights reserved
In addition to the hazard probability reports, the Geoscience INTEGRATOR system provides a single data warehouse in which the required data sets, derived hazard criteria, rock- burst damage probability assessments, and relevant files and documents are computed, stored, and made available to stakeholders through an interactive web browser, an interactive 3D visualizer, and automated or scheduled reporting. Engineers are now spending less time manipulating data in spreadsheets, and more time analyzing their data. The geohazard reports allow them to focus quickly on areas with increasing probability of rockburst hazard.

Valérie Laflèche - valeriel@mirageoscience.com
Latest news

Earth model’s themes are renamed

Python applications for geoscientific problems

Peak finder – Geoscience ANALYST geoapps: Python application

Documents linked to a project

Drape Voxet properties on surfaces

Editing property’s colormap

3D drillhole design and monitoring in Geoscience ANALYST Pro v4.0 – Virtual Lecture
New release – Geoscience INTEGRATOR 4.3

Q&A with Oleg Brovko, Senior Project Geophysicist at Geofocus

Quick selection search tool

Copying objects between Workspaces