


Geoscience ANALYST 4.0 allows you to compute drillholes’ deviation statistics. These include the mean, minimum, maximum, median, and standard deviation of the selected drillholes’ lift, swing, initial dip, and initial azimuth.
The selected drillholes can be filtered according to:
- 2D or 3D radius around a location: drillhole collars within the specified radius are selected.
- Initial orientation: drillholes whose initial orientation is within the specified value and tolerance are selected.
- Depth: statistics are computed below the specified depth for the selected drillholes.

The results can be copied to the clipboard for future reference and documentation. This information can be used when planning new drillholes with the Drillhole Designer in Geoscience ANALYST Pro.
Watch this recording for a demo, tips, and tricks.
Previous Geoscience ANALYST tips can be found under the Software tip category in our Resources page and in our Archives page.
Latest news

Using predictive modelling in mineral exploration
We carried out targeting work for IOCG-style mineralisation in the Mt Dore area of QLD, Australia. We produced a 3D model and predictive exploration map...

Have you Scene this?
In GOCAD Mining Suite v19, you can save the view as a Scene by right-clicking on the 3D Viewer > (Scene) Save As…

Snapshot grid sections
In GOCAD Mining Suite quickly take snapshots of your Voxet sections using the snapshot tool...

Extracting property names from a CSV
In Geoscience INTEGRATOR, extract the property names directly from a CSV file to speed up the process and reduce errors...

Quick selection search tool
In Geoscience INTEGRATOR we added a search box to help you find objects lists such as drillholes, samples, or stations that often have thousands of items...

Importing and preparing DC/IP data for inversion with Geoscience ANALYST – Virtual Lecture
In 20 mins, Kristofer shows v3.4 new functionality for pre-processing and visualization of DC/IP 2D and 3D data - Geoscience ANALYST...

GEOH5: A Framework for Geoscience Data and Model Portability
Used by thousands, GEOH5 is the open-source data structure that is taking down the interoperability barriers and revolutionizing...

Crustal scale gravity modelling and isostatic correction over central Chile
View recording - Thomas demonstrates how to apply an isostatic correction to gravity data through a case study over central Chile using...

The value of using structural restoration tools in exploration modelling – Virtual Lecture
Watch recording - Jean-Philippe shows the use of structural restoration tools in GMS as a modelling tool for structurally controlled deposits...

Used v/s available themes
In Geoscience INTEGRATOR, the Theme drop down menu shows a filtered list of those containing data sets by default...
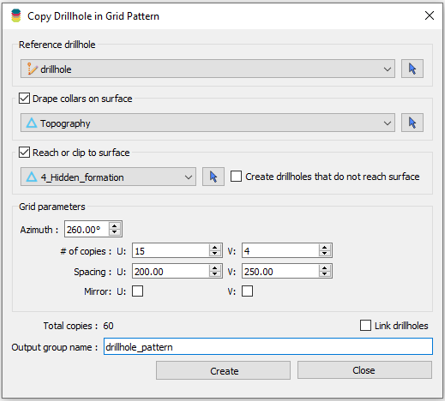
Copying drillholes in a grid pattern
In Geoscience ANALYST you can copy an existing drillhole’s collar and deviation in a grid pattern to map a mineralized horizon...

Arbitrary sections
In Geoscience ANALYST visualize your block model in any direction with the new arbitrary section