



The newest version of Geoscience INTEGRATOR brings exciting new features to help you manage your data more efficiently and streamline your workflow
Key new features:
-
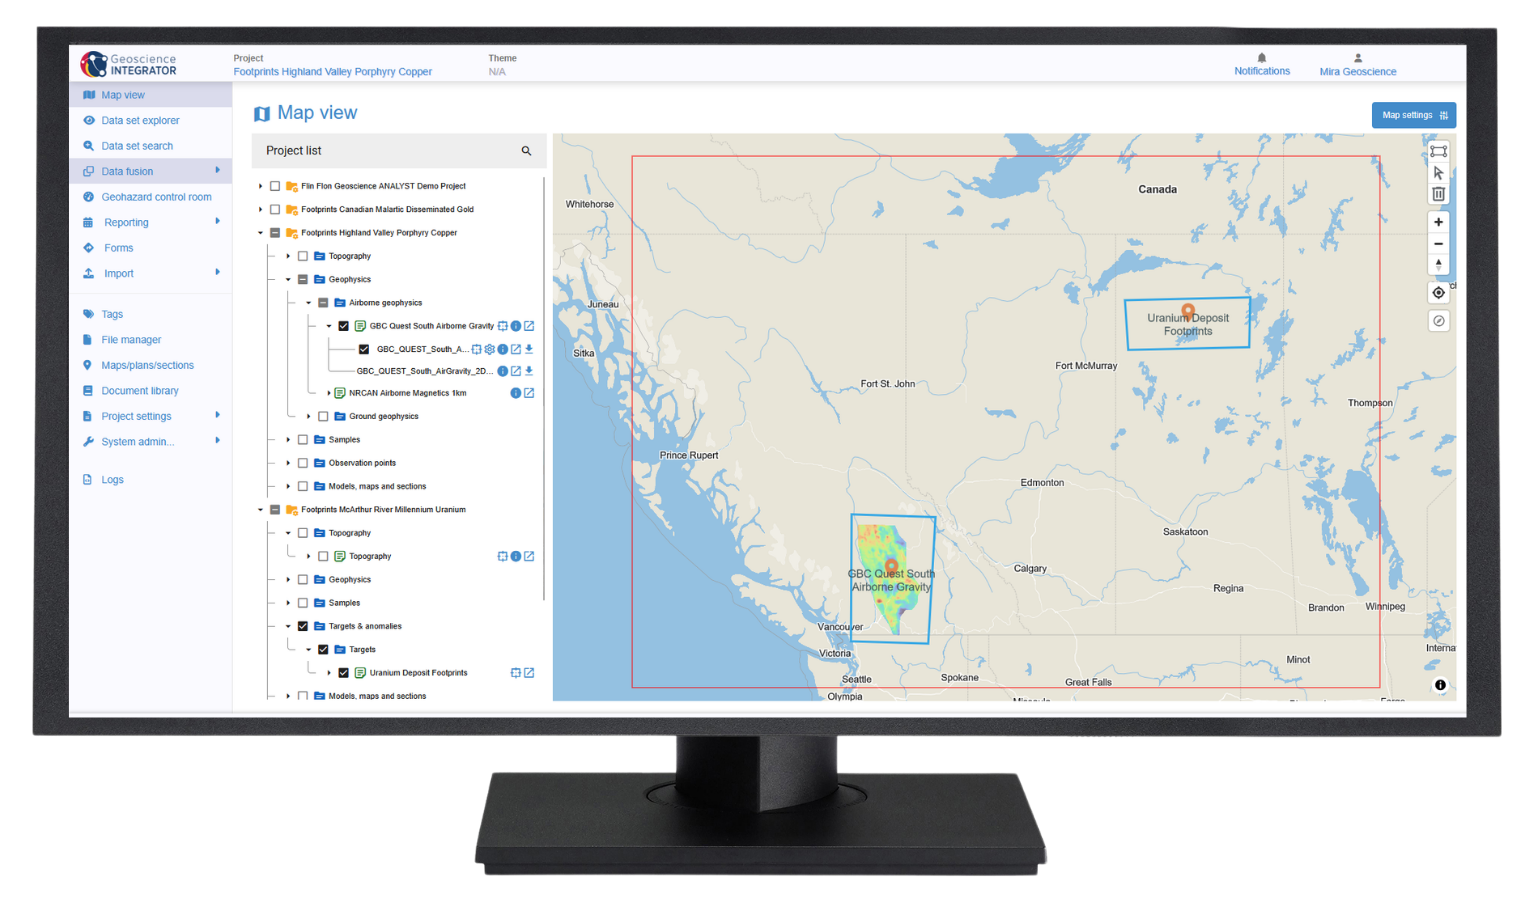
A new interactive 2D map interface for spatial data discovery
-
Data overwrite and replace across all drillhole themes
-
Data upload to Geoscience INTEGRATOR directly from Geoscience ANALYST
-
Email summary of recently imported data for project stakeholders
Is this your first time working with Geoscience INTEGRATOR?
Visit our YouTube channel, or check out the Resources tab on our website for additional information. You can also sign up for our email newsletter or join our community on LinkedIn to stay abreast of the latest news.
Please contact our team for additional information about our products and services
Latest news

Scripting
In Geoscience ANALYST Pro the Script on Object Property utility in Geoscience ANALYST Pro can be used in a wide variety of geoscientific applications...

Geoscience ANALYST Pro Geophysics Consortium
Focused on delivering software and methods that make the use of advanced geophysics a day-to-day, practical reality for industry.

Crustal scale gravity modelling and isostatic correction over central Chile
View recording - Thomas demonstrates how to apply an isostatic correction to gravity data through a case study over central Chile using...

Data fusion – Automatic sample compilation
In Geoscience INTEGRATOR, the Sample compilation page offers powerful tools to support the analysis of complex or difficult-to-view relationships within your sample data...

New release – Geoscience INTEGRATOR 4.1
Geoscience INTEGRATOR 4.1 unveils a range of new features and improvements designed to boost performance and enhance user experience.

K-means clustering: compute inertia curve
In Geoscience ANALYST Pro the K-means clustering utility includes the ability to compute the data’s inertia curve...

Finding data sets by tags and neighbourhoods
In Geoscience INTEGRATOR, you can can lookup data sets by the tags they carry and the neighbourhoods they cover...

Footprints project public data repository available soon
Project-generated and previously public data, models, and documents from the NSERC-CMIC mineral exploration project, “Integrated Multi-Parameter Footprints of Ore Systems...

Importing objects from project
In GOCAD Mining Suite you can easily import objects from one GOCAD project to another by...

Pointer Tracking
In GOCAD Mining Suite you can take advantage of the Pointer Tracking view to track coordinates, objects, and properties.

Block model volume
In Geoscience ANALYST you can visualize your block model data by volume in the Visual Parameters panel...
..

Getting started with the Python geoh5py
Past event, view here or via our YouTube channel...