


There are two ways to create classifications when importing data. For a ‘one off’ classification, you can provide the list of classes at the time of import. For classifications that may be used often, such as a rock code, you can create a project classification.

It is possible to assign colours to classes of the project classifications, ensuring consistent visualization of the data in charts and in 3D.

Previous tips can be found under the Software tip category in the News section and in the Archives section of our website.
Latest news

Plotting drillhole data
While pencil crayons are still a vital part of geology, Geoscience ANALYST lets you get all your data into 3D in a convenient shareable format...

Using comment field entries in drillhole databases to automatically re-log lithologies
This approach uses the comment field of the logging table to extract general topics that can then be used as learning features in a supervised machine learning classification approach.

Machine learning in mineral exploration
We have applied machine learning as part of custom solutions to complex exploration and geotechnical problems since 2015...
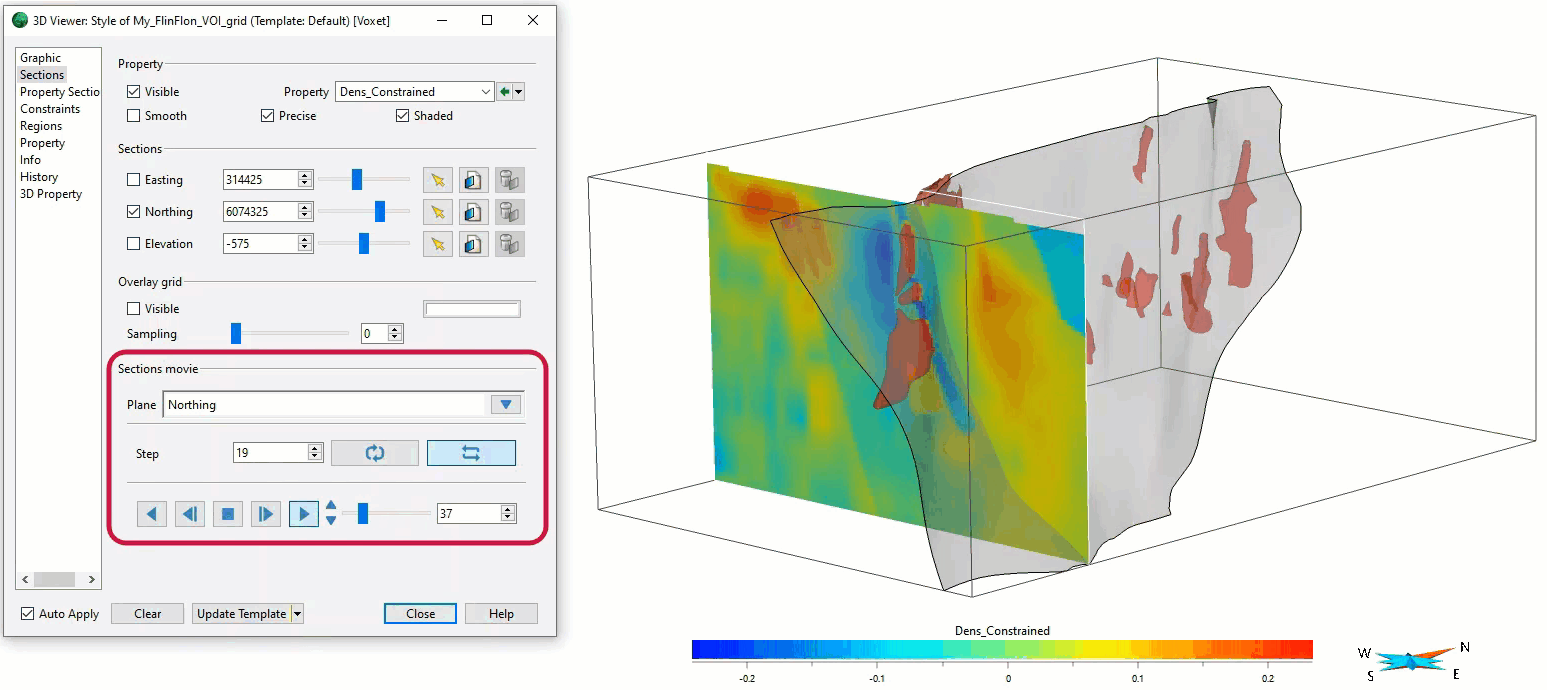
Sections movies
In GOCAD Mining Suite, you can create a section animation by specifying which section plane you want to visualize...

Copying objects between Workspaces
In Geoscience ANALYST objects can be copied from one Workspace to another by using Ctrl+C and Ctrl+V...

Search for Objects – find anything, anywhere, anytime
In GOCAD Mining Suite find any objects you're looking for in no time...

Display multiple Voxet sections
In GOCAD Mining Suite, you can create additional sections, hide/show them, use the slider and arrow to position them along the Voxet, and delete them...

Attending PDAC 2026?
Visit us at booth 814 to see our software solutions in action and discuss your needs with our expert team!

Have you Scene this?
In GOCAD Mining Suite v19, you can save the view as a Scene by right-clicking on the 3D Viewer > (Scene) Save As…

3D seismic data
In Geoscience ANALYST you can import and visualize 3D seismic data, and plan your next seismic survey with the seismic reflection survey designer....

GEOH5: A Framework for Geoscience Data and Model Portability
Used by thousands, GEOH5 is the open-source data structure that is taking down the interoperability barriers and revolutionizing...

John McGaughey receives the Grahame Sands Award
John McGaughey, President of Mira Geoscience, receives ASEG's 2024 Grahame Sands Award for a career dedicated to innovation in applied geophysics.