


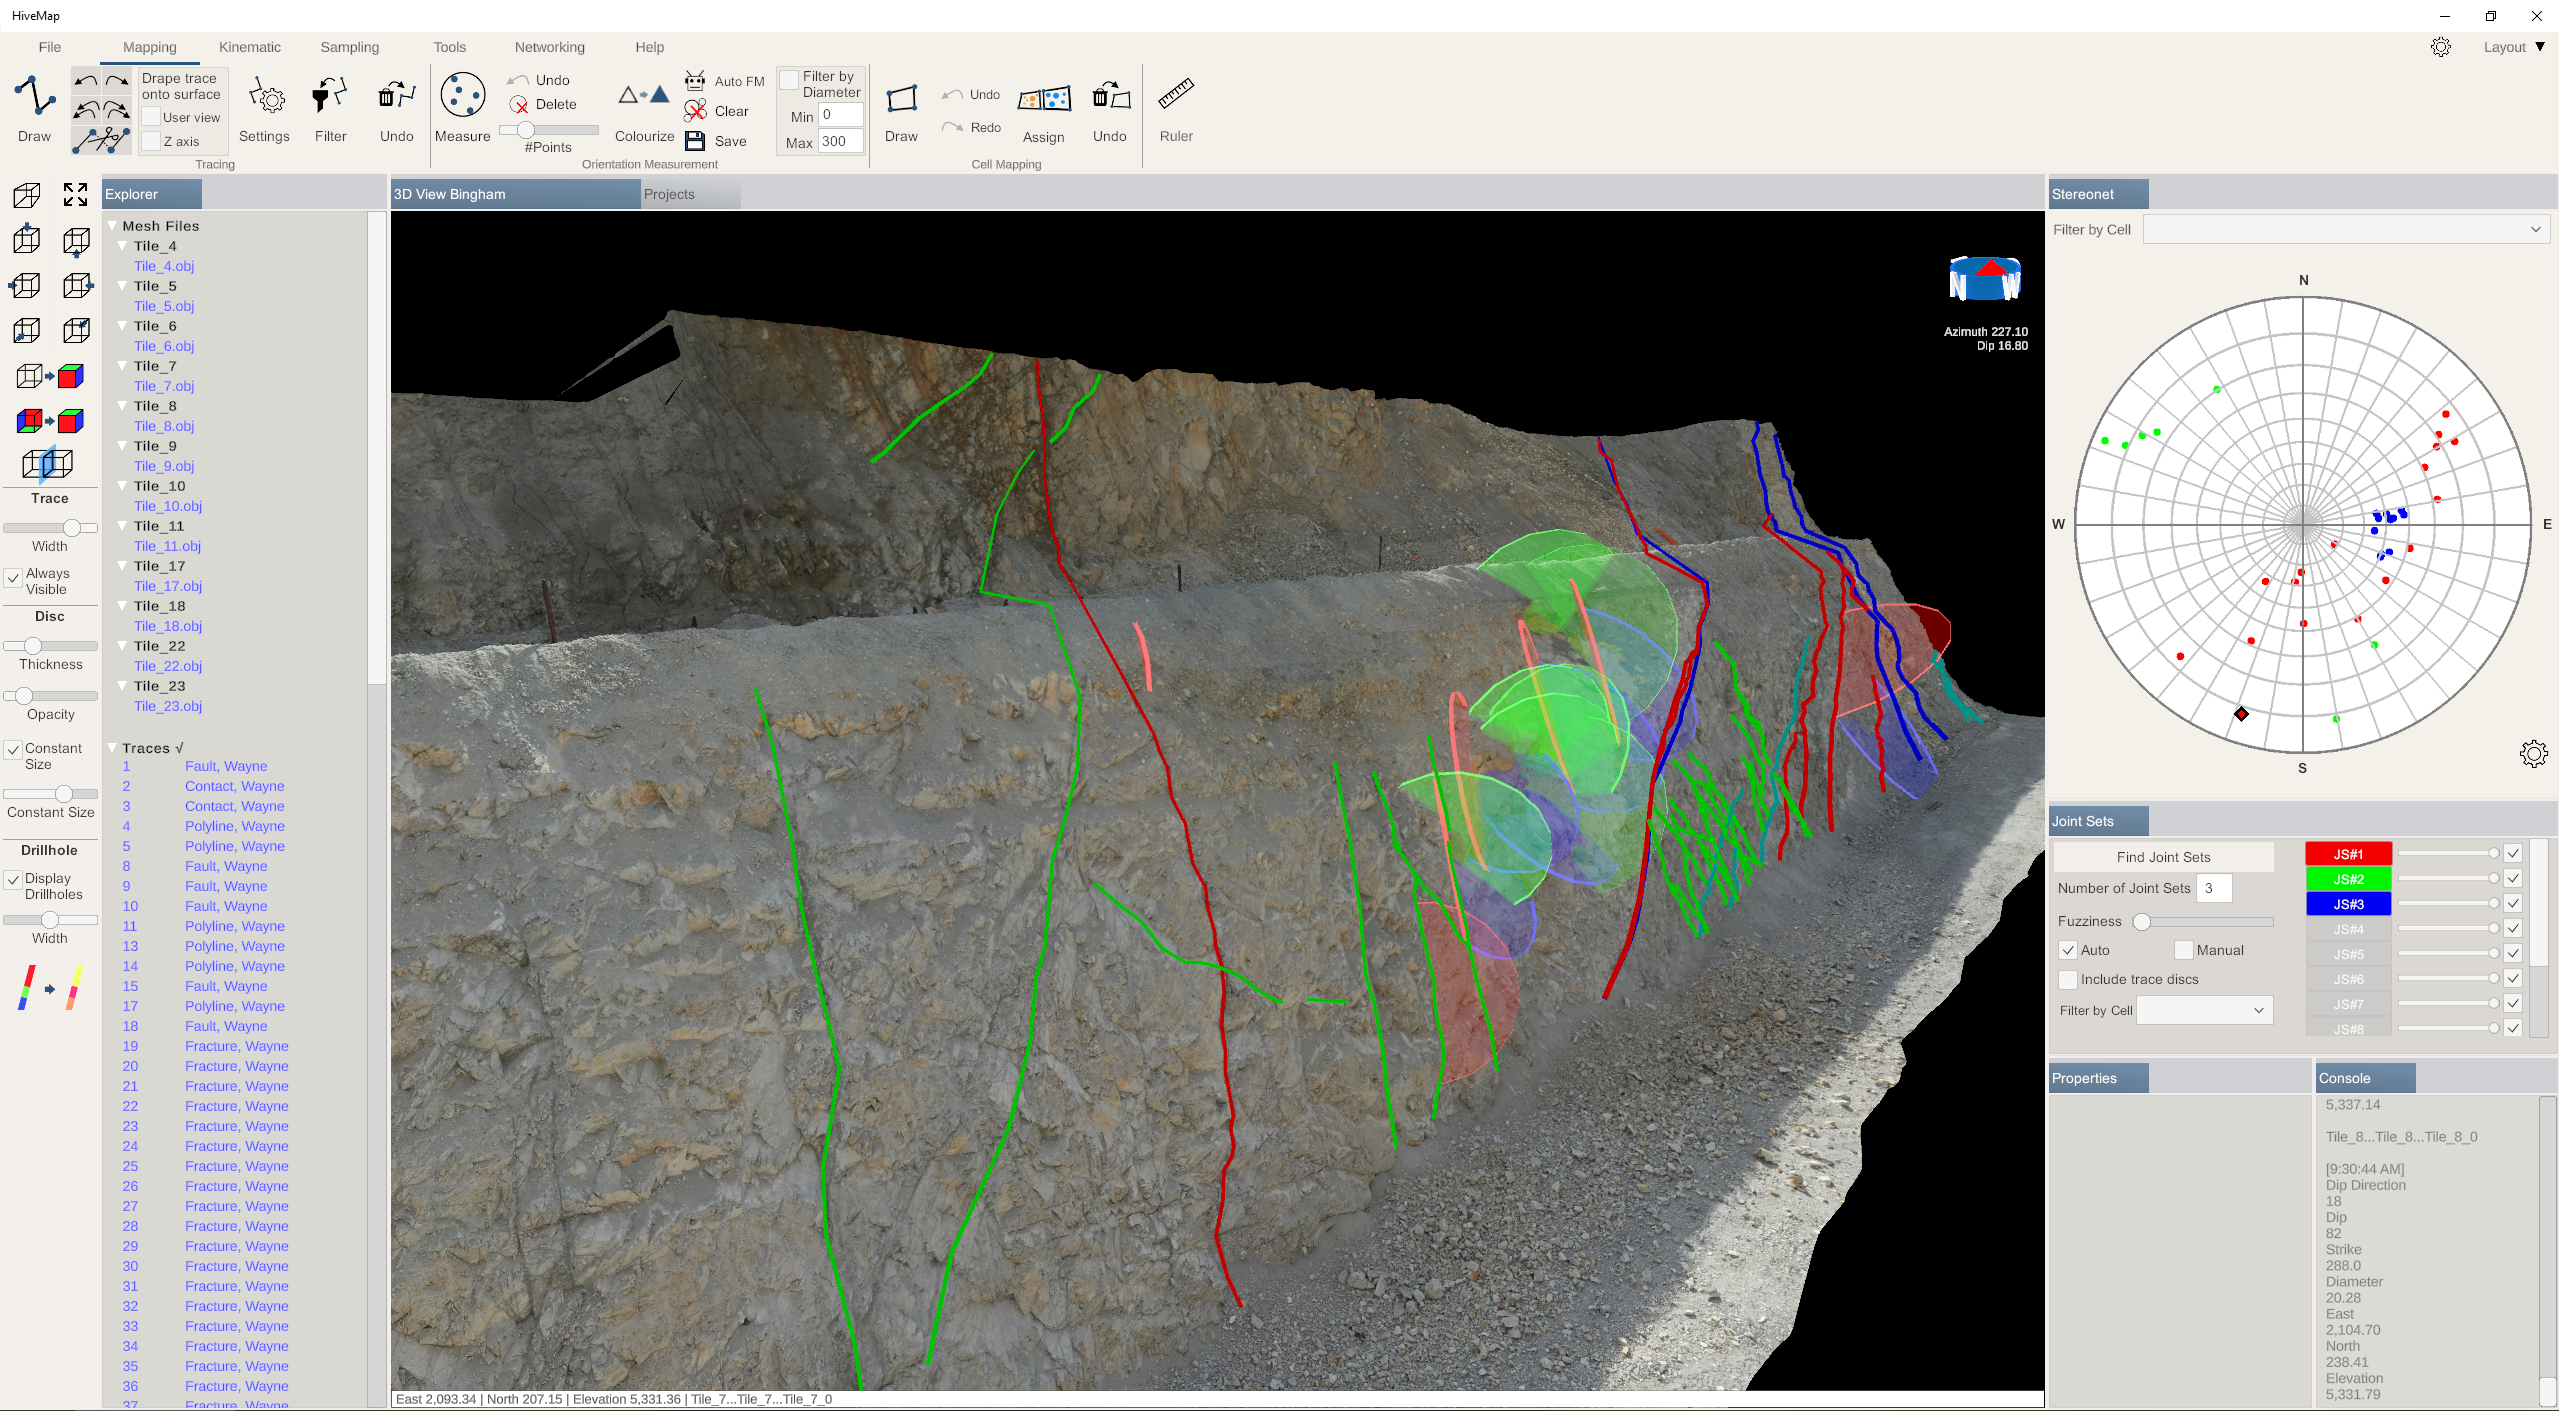
What Is HiveMap?
HiveMap is a digital mapping and outcrop analysis tool that allows you to capture geological observations quickly, safely and accurately, both in the field and office and rapidly assimilate the results into downstream modelling workflows. Flexibility is key in the software design principles; HiveMap is designed to integrate with existing workflows with minimal disruption, being able to utilize very high-resolution surfaces with textures from almost any photogrammetry or LiDAR scanning tool, and can output results in formats that can be used in a wide array of standard industry software packages.
Additional functionality has been incorporated to support technical specializations, including cell mapping tools for geotechnical engineers, and sampling tools for grade control geologists.
Where Can HiveMap Be Used?
Mapping and understanding of the earth’s surface and subsurface is a requirement across almost every earth science discipline and a critical input in every phase of mining from exploration through production. To date, HiveMap has been used to interpret large-scale topographies and satellite photos and map both open pit and underground in active mining environments. With interfaces optimized for both desktop and tablet, HiveMap gives users a seamless experience between the field and office, leveraging the benefits of each hardware type to give users the best experience regardless of working environment!
A core development principal has been making mapping accessible, rather than pushing users into using an expensive or proprietary piece of hardware. HiveMap runs on off-the-shelf tools, making access and use easy, reducing hardware costs, and making it straightforward to provide redundancy and replacement when working in the typically rough, damp and dusty environments that face geoscientists on a daily basis.

Collaboration and Sharing
Collaboration tools are built directly into HiveMap, enabling all decision-makers to interact and discuss the geology and technical challenges in the same 3D space. Our goal is to break down the silos between disciplines and bridge the gap between sites and head offices, bringing everyone together to look at and discuss their projects and deposits in real-time.
Traditional approaches to mapping, and available geological mapping tools, often lead to different technical teams mapping using different tools, different approaches, and in the worst situations, mapping different datasets. This can rapidly lead to disconnects between observations, and a loss of trust in the observations gathered. HiveMap is designed to give all technical users access to the same high-quality datasets, make decisions in a single unified space, work together, and understand the development of the mapping dataset through time.
Synergies With Field Mapping
Let’s start off with a strong position here: field mapping is an absolute requirement in order to make good decisions about the geology, which then inform our different technical studies.
Digital mapping using HiveMap does not replace field mapping at the rock face but does synergize with it by providing the mapper with access to a wider area of accurately georeferenced mappable surfaces than traditional mapping alone. Data accuracy is fundamental for achieving high-quality geological interpretations for engineering and grade control projects; however many outcrops, or open pit and underground exposures are not easily or safely accessible, limiting the area that can be mapped by field studies alone.
User Testimonial
SRK uses HiveMap to capture accurately located geological data from high-quality georeferenced terrestrial or drone photogrammetry or LiDAR models, thereby extending the field interpretation to include data from locations that are physically inaccessible.
Structural geology physical mapping and interpretation is based on four important parameters that need to be characterized: (1) structural pattern, (2) fault infill strength properties, (3) fault continuity, and (4) kinematic data evidence. HiveMap provides tools to capture these data, including customizable tools for describing fault geometry and fault infill properties determined from field mapping.
For SRK, the most empowering application of HiveMap has been the interpretation of large-scale fault pattern and continuity for inaccessible pit slopes and grassroots mapping in mountainous areas, providing a scale of geological interpretation difficult to previously achieve.
HiveMap: The Future of Mapping
Over the next few weeks, we look forward to sharing more details about the software. This includes the workflows and analysis it supports, practical guides on how to get the best out of digital mapping, as well as guest spots from users discussing their experiences, and the value that HiveMap brings to them. To stay up to date with future blog posts and case studies, or schedule a demo, please reach out to us via our contact form.
Join us as we map our way into the future!
Please contact our team for additional information about our products and services
Latest news

GEOH5: A Framework for Geoscience Data and Model Portability

Mira Geoscience receives the 2023 AME Innovation Award

New release – Geoscience ANALYST 4.6

Machine learning in mineral exploration


Chasing Innovation from the Ground Up

A robust workflow for regional porphyry targeting; Application to the QUEST-South project area in southern British Columbia

Customizing metadata

New release – Geoscience INTEGRATOR 4.2
Property value range

3D seismic data and survey designer tools
