


In Geoscience INTEGRATOR v3.5, you can now lookup data sets by the tags they carry and the neighbourhoods they cover.

Previous tips can be found under the Software tip category in the News section and in the Archives section of our website.
Latest news

GOCAD Mining Suite – A geological modelling powerhouse
Past event, recording link available here...
Using ioGAS in Geoscience ANALYST Pro – Virtual Lecture
Past event, recording available here...

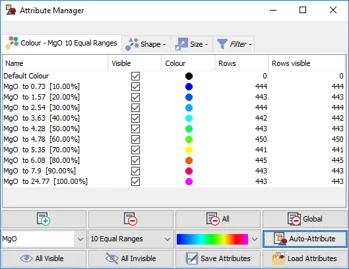
K-means clustering
In Geoscience ANALYST Pro’s v3.3, you can quickly partition your data based on the K-means clustering...

New raster imports
In Geoscience ANALYST you can now import GeoTIFF (tif, tiff), ERMapper (ers), and Surfer (grd)...
..

R&D projects in data management
Over the past couple of years we have been developing skills and technology in practical, business-focused data management as a solid foundation for modelling, analysis, and interpretation.
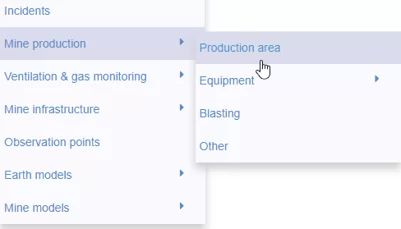
New mine production theme
In Geoscience INTEGRATOR, version 3.2 has a new theme called Production area. It’s designed for stope, mining room, or drawpoint data...


Revolutionizing Subsurface Interpretation and 3D Visualization with Geoscience ANALYST Pro
Discover how EnBW is bridging the gap between 2D mapping, 3D seismic interpretation, and integrated geophysical workflows

Documents linked to a project
When documents are linked to a project in Geoscience INTEGRATOR, it is possible to be more specific and link them to the project’s data sets...
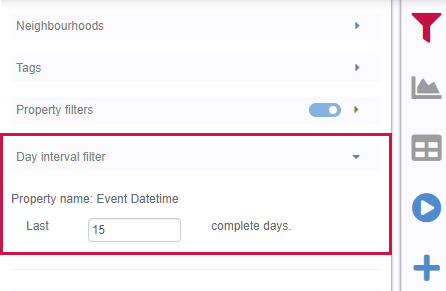
Day interval filters
In Geoscience INTEGRATOR the Day interval filter can be used to search your time-based data for “the last X days”, or...
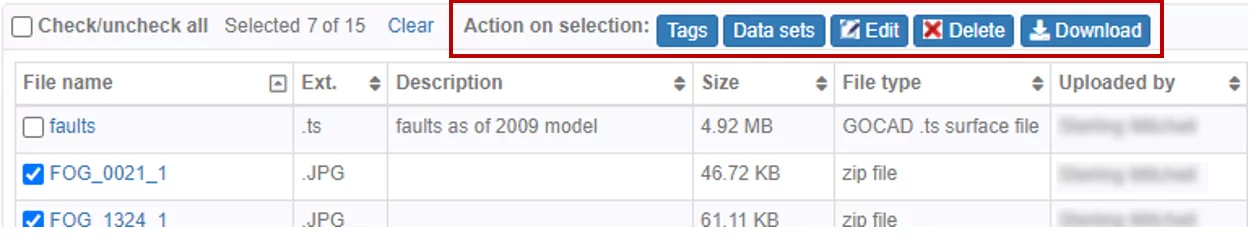
Operations on multiple files
In Geoscience INTEGRATOR, you can carry out various operations on multiple files simultaneously...

GEOH5: A Framework for Geoscience Data and Model Portability
Used by thousands, GEOH5 is the open-source data structure that is taking down the interoperability barriers and revolutionizing...