Coffee break… and learn!
Available on our YouTube channel

In this lecture, Shaun O’Connor showed how to get started with moving drillhole data between Geoscience ANALYST and Python using the geoh5py library. This demonstration included creating a pandas dataframe from a drillhole log in Geoscience ANALYST, analyzing and interpreting the data using Python tools, and exporting the results back to Geoscience ANALYST for visualization in 3D.

Episodes become available on our YouTube channel. More details about this series can be found on our Events page or join the mailing list.

Shaun is an exploration geologist with 10 years of experience in exploration and mineral systems modelling for gold, base metals, lithium, and industrial minerals in varied geological environments, including Cordilleran arcs and intrusions, Archean greenstone belts, and bimodal volcanic systems. Before joining us, Shaun leveraged his strong geological field experience, software expertise, and talent for modelling and research to help unlock the value of geological data and revolutionize exploration frameworks for clients ranging from independent prospectors to top gold producers worldwide. Shaun obtained his MSc in geological sciences from Queen’s University and is based in Halifax, Canada.

Latest events and news

July, 14 2022

Georeference images

In Geoscience ANALYST Pro you can georeference your geology maps and cross sections with...
Read more
October, 19 2020

Viewing data from report items

In Geoscience INTEGRATOR table and chart items from ad-hoc or scheduled reports can be easily refreshed, using the same filters that were applied in the original report, to display current data.
Read more
June, 06 2022

Coordinate system transformations

In Geoscience ANALYST Pro version 4.0, you can apply coordinate system transformations to...
Read more
May, 03 2019

Documents linked to a project

When documents are linked to a project in Geoscience INTEGRATOR, it is possible to be more specific and link them to the project’s data sets...
Read more
March, 01 2022

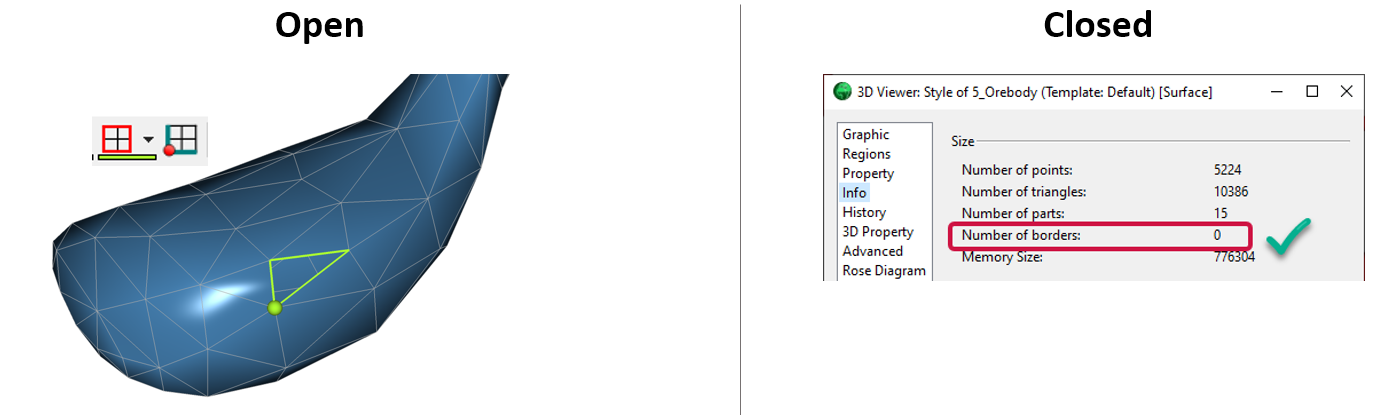
Is the surface opened or closed?

In GOCAD Mining Suite you can easily know if your surface is opened or closed by...
Read more
March, 16 2020

View neighbourhoods in 3D

You can display your neighbourhoods in Geoscience INTEGRATOR 3D viewer, making it easier to understand spatial distribution of the data.
Read more
June, 01 2022

Macros

In GOCAD Mining Suite you can save lots of time with SKUA-GOCAD’s macros, a built-in scripting tool in which you can record or enter a sequence of commands to carry out or repeat at any time...
Read more
April, 01 2022

K-means clustering: compute inertia curve

In Geoscience ANALYST Pro the K-means clustering utility includes the ability to compute the data’s inertia curve...
Read more
How-to videos
January, 24 2022

Creating 3D geological starting model from geological maps and structural measurements

In this lecture, Philippe generates a 3D geological model from a map with structural measurements in Geoscience ANALYST...
Read more
Developer’s sandbox
September, 13 2013

R&D projects in data management

Over the past couple of years we have been developing skills and technology in practical, business-focused data management as a solid foundation for modelling, analysis, and interpretation.
Read more
May, 11 2022

Effective date field

Geoscience INTEGRATOR v3.7 offers the Effective date upload field for files and maps...
Read more
November, 10 2021

New filter options on the File manager and the Maps/plans/sections

In Geoscience INTEGRATOR, you can now find files quickly by using the new extension, tags and uploaded by filters...
Read more

Please contact our team for additional information about our products and services