



Reference images can be added to mine fusion models and hazard reports to better orient yourself visually. You can upload images like level plans, drift outlines or secondary grids.


Previous tips can be found under the Software tip category in the News section and in the Archives section of our website.
Latest news

New release – GOCAD® Mining Suite 22 update1
GMS 22u1 comes with improved connectivity to Geoscience ANALYST and better interoperability with GEOH5.

Uploading multiple files
In Geoscience INTEGRATOR, you can upload multiple files in one simple step...

Data set summaries
In Geoscience INTEGRATOR The Data set explorer provides simple, immediate ‘dashboard’ access to all the data sets, and their summary information...

VPmg, VPem1D and VPutility release
VP Geophysics Suite releases: VPmg version 9.3, VPem1D version 4.3 and VPutility version 1.2...
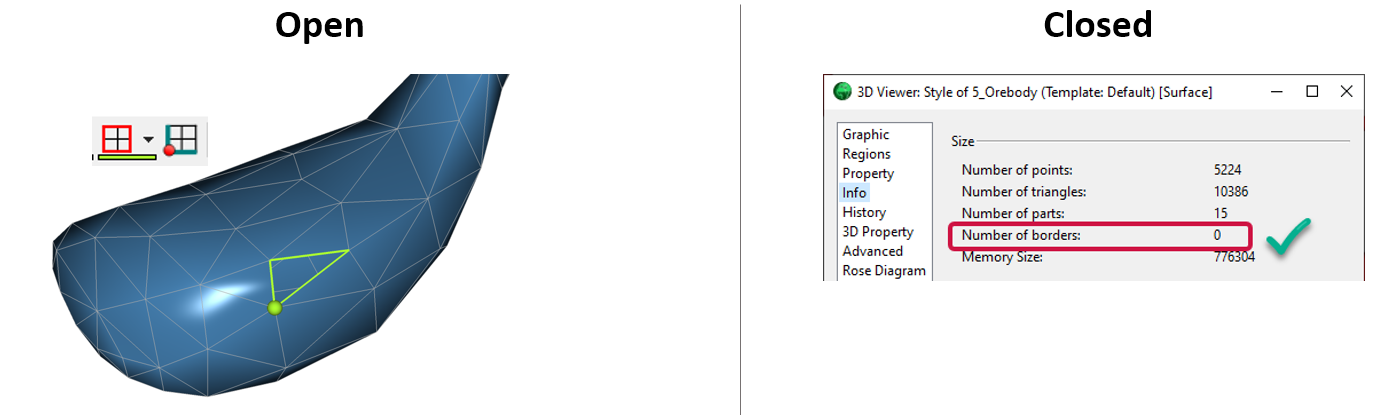
Is the surface opened or closed?
In GOCAD Mining Suite you can easily know if your surface is opened or closed by...

Earth model’s themes are renamed
In Geoscience INTEGRATOR v3.7, the “Earth models” theme group is renamed “Models, maps and sections” and the theme’s names were...

Documents linked to a project
When documents are linked to a project in Geoscience INTEGRATOR, it is possible to be more specific and link them to the project’s data sets...

Managing import templates
In Geoscience INTEGRATOR it is possible to edit Import template names and no-data values, activate/deactivate templates, see...

Search for data by spatial extent
This video shows you how to search for data from Geoscience INTEGRATOR by spatial extent...

Quick selection search tool
In Geoscience INTEGRATOR we added a search box to help you find objects lists such as drillholes, samples, or stations that often have thousands of items...

Default data colour settings
In Geoscience ANALYST you can set a default colour table and colour mapping transformation function. This way, when you import or create new data, it will be coloured by default.

Object’s Info
In GOCAD Mining Suite you can see how many nodes or triangles your Surface object consists of by right-clicking on...