


Coffee break… and learn!
Also available on our YouTube channel
In this lecture, Philippe Drouin will generate a 3D geological model from a map with structural measurements. Starting with digitized lithology curves from a Shape file, point-based structural measurements, a topography surface, and an area of interest, he will generate closed surfaces and assign lithology properties to a block model utilizing the capabilities of Python plugins within Geoscience ANALYST.
Episodes from this monthly series are available on our YouTube channel. More details about this series can be found on our Events page or join the mailing list.

Philippe joined our team as a junior consultant. He has experience in modelling of alteration, mineralization and lithology 3D solids in a copper porphyry context. He has also acquired skills towards principle component analysis and statistical data interpretation. Before joining Mira Geoscience, Philippe worked as an exploration geologist on a variety of projects including orogenic and intrusion-related gold deposits and porphyry copper deposits performing field mapping, selective sampling, statistical analysis and drillhole planning. Philippe obtained his MSc diploma in Economic Geology from McGill University and is based in Quebec-City, QC, Canada.
Latest events and news

Rock reclassification editor
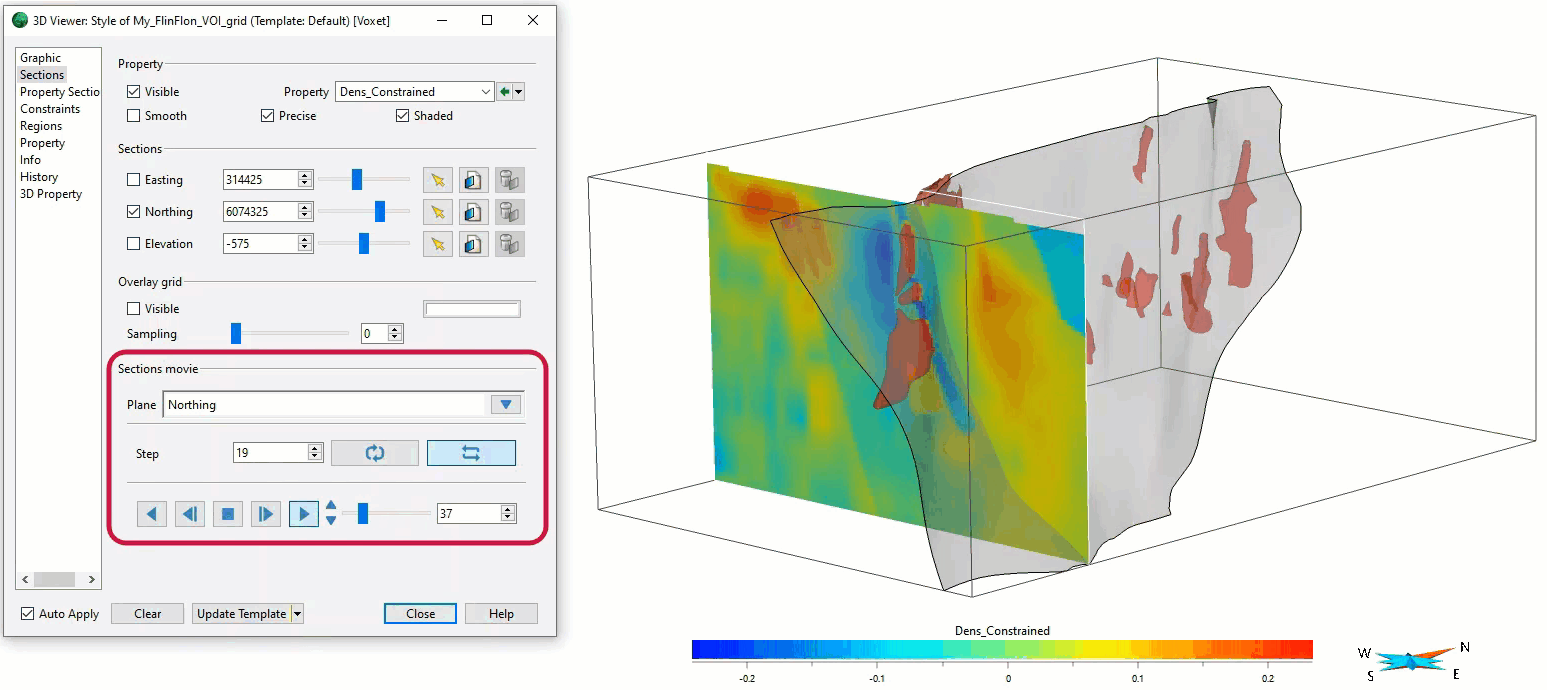
Sections movies

Reopening selected commands

Editing file settings

Find and Replace

K-means clustering: compute inertia curve

Attending PDAC 2026?
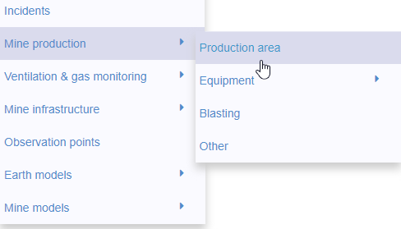
New mine production theme

Improved data analysis

Have you Scene this?

Footprints project public data repository available soon
