


In the Data Colours panel you can control the precision of the data. You can choose how many decimal digits you want to display and change it to scientific notation.
These changes are reflected in the statistics of the Data Colours panel and in the Data Table columns.
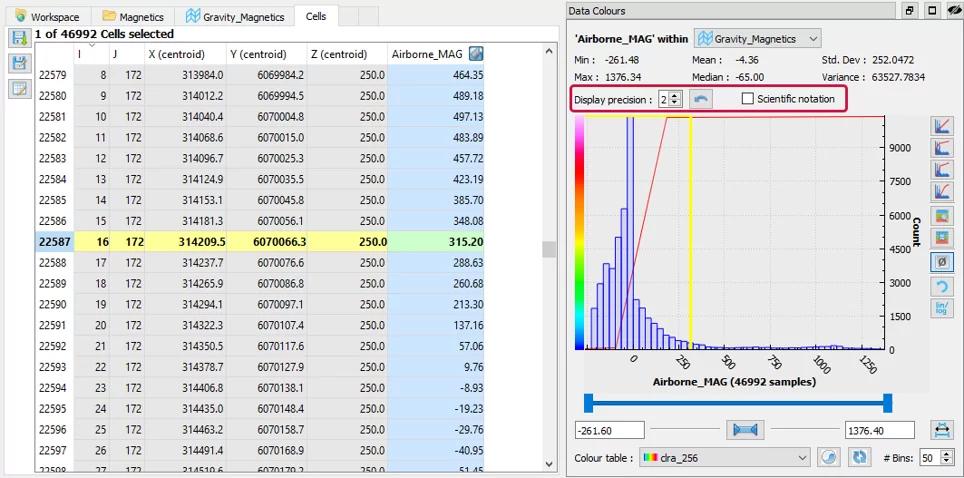
Note that when exporting this table as a csv through Geoscience ANALYST Pro, the exported data will retain the displayed precision.
Geoscience ANALYST Pro offers low-cost tools for interpretation, targeting, and geophysical inversion. Activate your 10-day Free Trial now through the user interface.
Previous tips can be found under the Software tip category in our News page and in our Archives page.
Latest news

Automatic rotation
In Geoscience ANALYST you can autorotate viewport when presenting your 3D geoscientific data and models...

Property value range
In Geoscience INTEGRATOR, You can refer to the range of values in the query panel to apply numeric property filters...

Quick selection search tool
In Geoscience INTEGRATOR we added a search box to help you find objects lists such as drillholes, samples, or stations that often have thousands of items...

Attending PDAC 2026?
Visit us at booth 814 to see our software solutions in action and discuss your needs with our expert team!
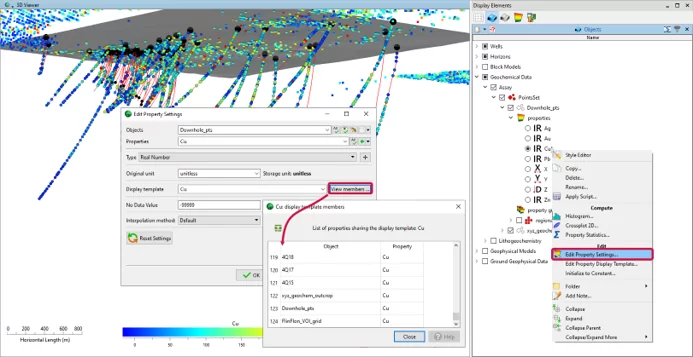
Editing property settings: Display template
In GOCAD Mining Suite you can editing property settings through display templates...

Bounding boxes in the viewer
Coloured bounding boxes are used to highlight volumes in the Viewport: A purple box surrounds your current selection...

Georeference images
In Geoscience ANALYST Pro you can georeference your geology maps and cross sections with...

Display multiple Voxet sections
In GOCAD Mining Suite, you can create additional sections, hide/show them, use the slider and arrow to position them along the Voxet, and delete them...

Using predictive modelling in mineral exploration
We carried out targeting work for IOCG-style mineralisation in the Mt Dore area of QLD, Australia. We produced a 3D model and predictive exploration map...