


Coffee break… and learn!
Available on our YouTube channel
In this lecture, Thomas Campagne demonstrates how to apply an isostatic correction to gravity data through a case study over central Chile. Data consists of the World Gravity map (BGI) and ground data. The isostatic response is calculated by building a crustal model using the GEMMA crustal model (Reguzzoni & Sampietro, 2015) and computing its gravity response through forward modelling. Regional trends will be accounted for, and model boundaries edge effects minimized with the implementation of model incision. Geoscience ANALYST Pro Geophysics and the VPmg inversion software offer a way forward with flexible model creation and modelling capabilities. This lecture also shows how to:
- Build a model that explicitly represents the crust
- Compute the gravity response of the crust
- Incise a local model into a regional model
- Perform a 3D inversion of gravity data

Thomas’s expertise is in geophysical interpretation for mineral explorartion. His career initially focused on supervising and conducting ground geophysical surveys including IP, TDEM, and magnetics. His systematic approach to geophysical data processing and interpretation has evolved into 3D geologically-constrained geophysical inversion and integrated geological interpretation. Thomas obtained his MSc in Geophysics from l’École et Observatoire des Sciences de la Terre Strasbourg, France. Thomas is based in Vancouver.
Latest events and news

Importing and preparing DC/IP data for inversion with Geoscience ANALYST – Virtual Lecture

Search for Objects – find anything, anywhere, anytime
Why Is Mapping Important?

Machine learning in mineral exploration

Footprints project public data repository available soon

Importing objects from project

Uploading multiple files

New clustering application in geoapps
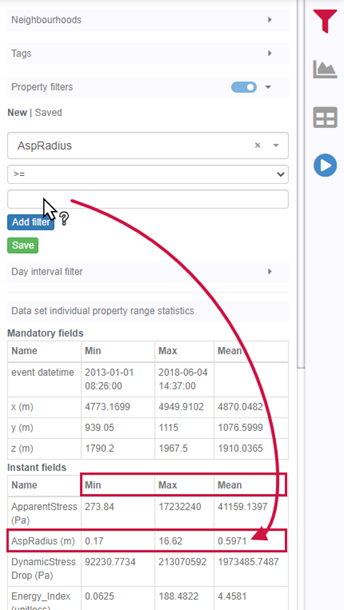
Property value range

Deep Learning as an alternative to downward continuation filters for structural interpretation

Python API live link
