


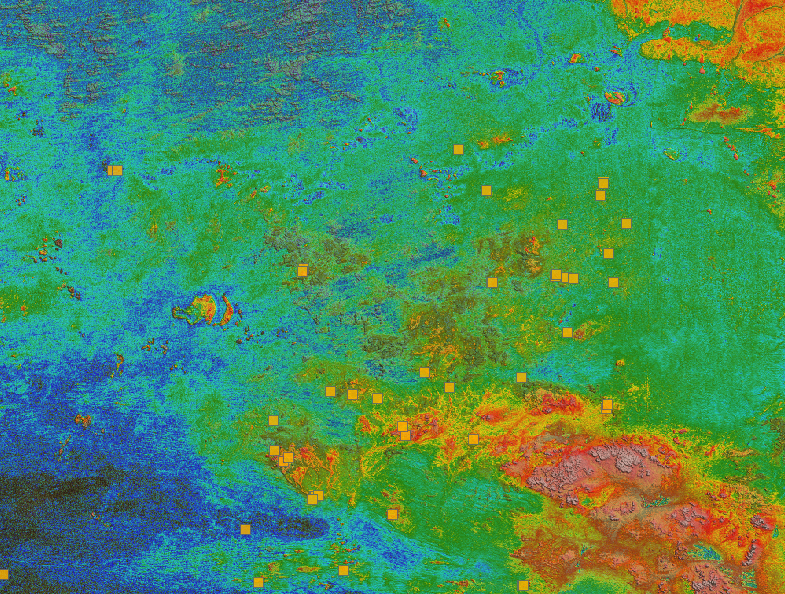
In the property’s Style Editor, you can reverse and complement your colormap or change the number of colors. You can also try changing the property’s transparency, high and low clip values, and scale type.

Previous tips can be found under the Software tip category in the News section and in the Archives section of our website.
Latest news

How to run gravity inversions in a geologically driven way
Past event, view here or on our YouTube Channel to see how to run a 3D inversion and forward modelling in Geoscience ANALYST Pro using VPmg...
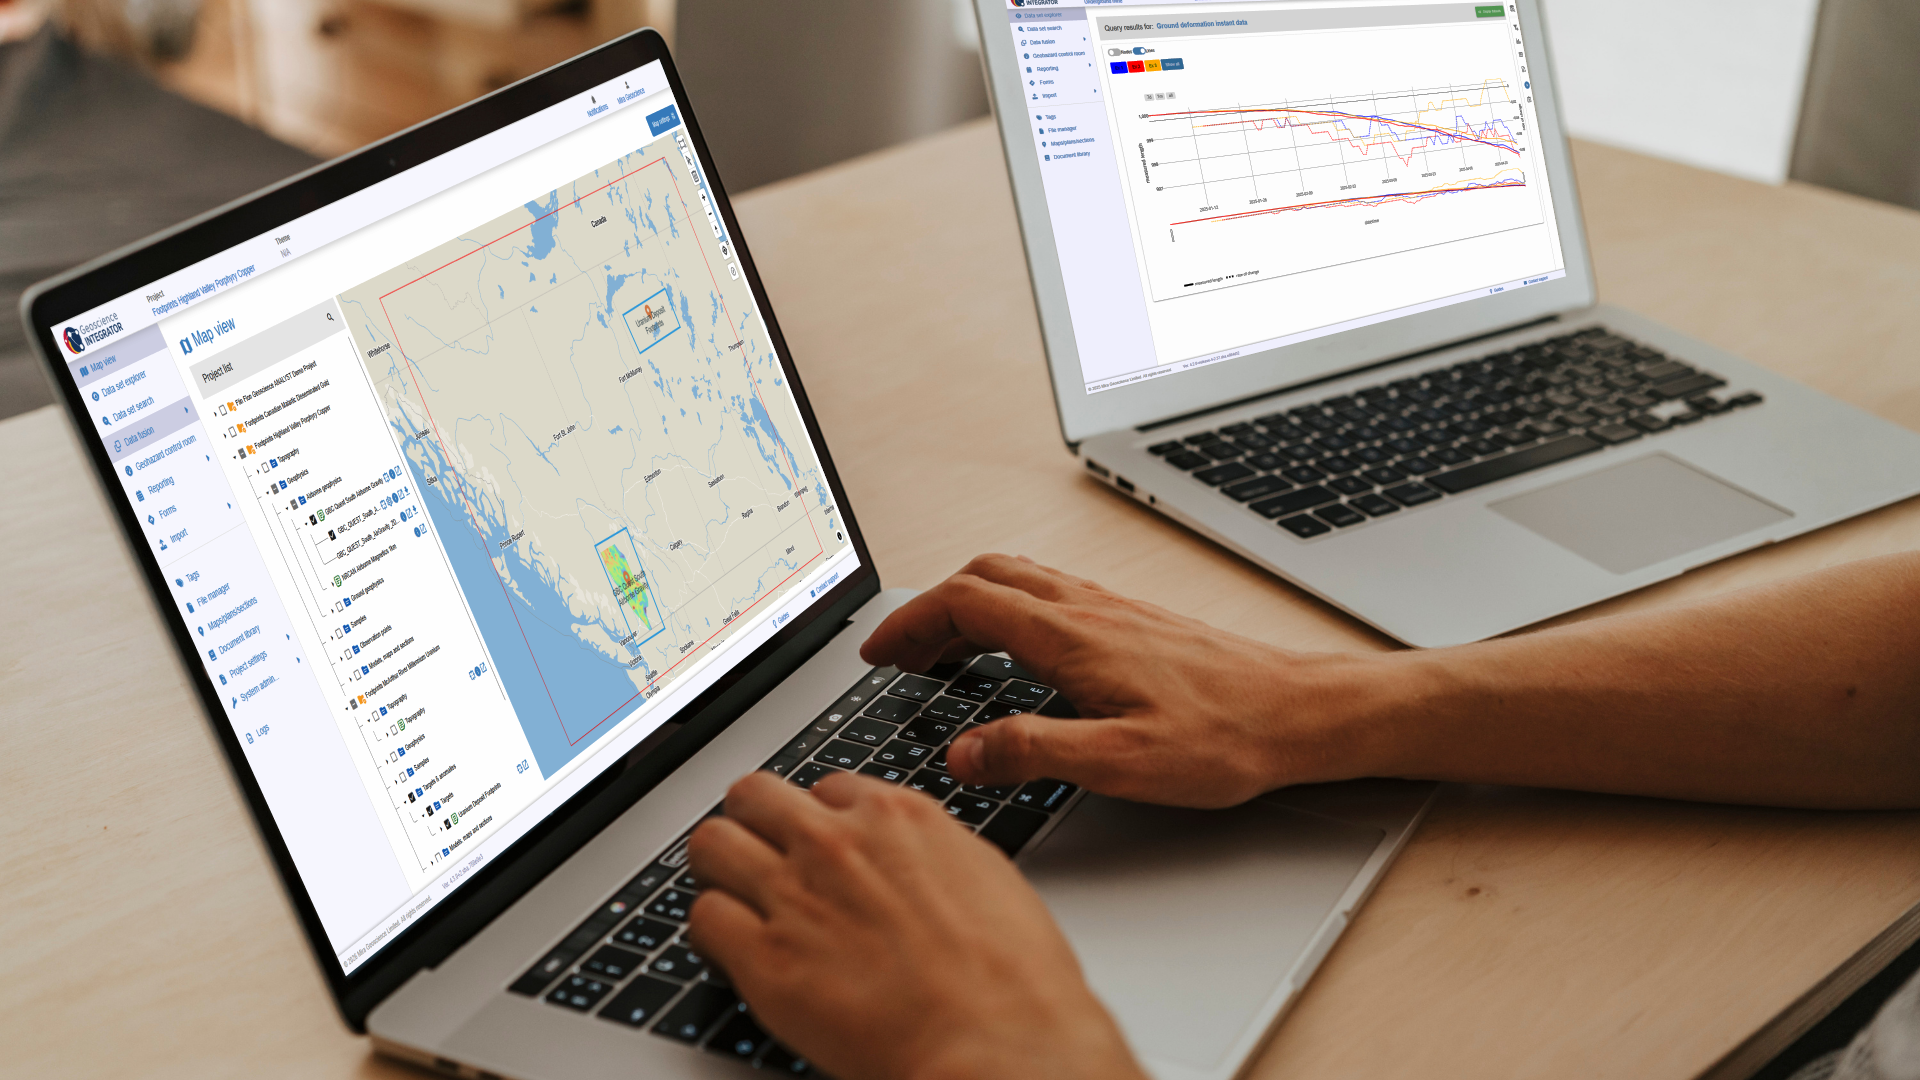
New release – Geoscience INTEGRATOR 4.3
Geoscience INTEGRATOR 4.3 introduces exciting new features to help you manage your data more efficiently and streamline your workflow

Filtering time-based data
In Geoscience INTEGRATOR, there are various ways to filter time-based data, by shirts, property, or even day intervals...
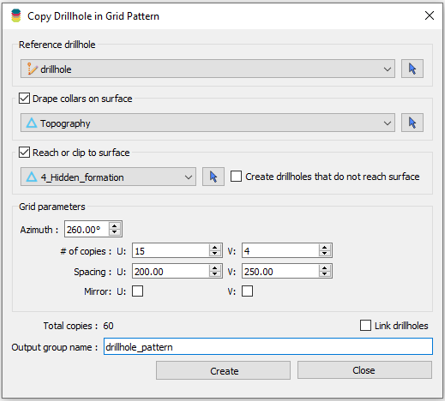
Copying drillholes in a grid pattern
In Geoscience ANALYST you can copy an existing drillhole’s collar and deviation in a grid pattern to map a mineralized horizon...

New release – Geoscience INTEGRATOR 4.2
Geoscience INTEGRATOR 4.2 unveils a range of new features and improvements designed to boost performance and enhance user experience.

UDMN Award of Excellence
Geoscience INTEGRATOR wins - Last December, UDMN presented us with an Outstanding Achievement in Commercialization...
Building a greenfields project from public data in Geoscience ANALYST Pro – Virtual Lecture
See recording - Gem shows how Geoscience ANALYTS is a great tool to do exploration without getting your boots dirty...
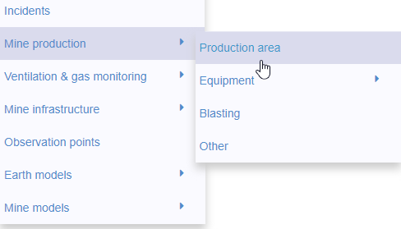
New mine production theme
In Geoscience INTEGRATOR, version 3.2 has a new theme called Production area. It’s designed for stope, mining room, or drawpoint data...

DC resistivity inversion in Geoscience ANALYST Pro Geophysics
Past event, view here or via our YouTube channel...

Deep Learning as an alternative to downward continuation filters for structural interpretation
Jean-Philippe Paiement proposes an alternative approach to the commonly used downward continuation filters used in the industry...

Data fusion – Automatic sample compilation
In Geoscience INTEGRATOR, the Sample compilation page offers powerful tools to support the analysis of complex or difficult-to-view relationships within your sample data...

No-data values on import templates
In Geoscience INTEGRATOR, you can prevent importing no-data value strings by providing a general NDV to be applied to all properties of the template...