


Safety is always the number one priority on every job and work site. Whether in underground, open pit, or civil engineering settings, our most important job is to make sure that everybody goes home safe every day.
The development team at HiveMap, a leader in digital mapping software solutions, understands that a significant part of being safe is having enough quality knowledge to make good design decisions when it comes to engineering; if we can’t make good observations of available rock exposures as input to models, the models aren’t informed, and shouldn’t be trusted! And so, we are faced with a dichotomy, to keep geological staff safe, we need to make observations of what are often high-risk areas, but being in or close to those high-risk areas to take the observations exposes people to hazards.
Field Mapping Restrictions
Often times geologists and engineers are limited in access to the rock face, facing a range of common problems that may include:
- Safety restrictions limiting direct access to pit slope benches or underground mine areas.
- Inaccessible terrain or steep slopes, making access difficult.
- Ongoing mine development cutting off previous rock exposure, making certain areas of a mine inaccessible for conventional mapping.
- General availability of technical staff to undertake conventional mapping efforts on newly exposed areas.

New Scanning Technology
Collection of the data remotely limits the exposure risks normally present in conventional mapping, and the evolution of technology has created many new opportunities for the capture of 3D, georeferenced representations of rock exposures and topographies, complete with overlaid coloured images and textures. Drones in particular have transformed our ability to generate photogrammetry and LIDAR scans of underground and open pit mining operations, engineering projects, and exploration areas. Generation of extensive coverage of exposure (which may not be safe to approach in the field!) is now cheaper, faster, easier, and more reliable than ever before.
Let’s not forget that generating mappable digital surfaces is not limited to expensive hardware that needs specialists to operate and process. The cellphone, sitting in everyone’s pocket, has photogrammetry apps available to collect small scale outcrop models. In fact, the latest Apple iPhone Pro has LiDAR sensors built in which can be used quickly and easily generate mappable surfaces!
Information Versus Knowledge
However, information is not knowledge, and it is knowledge and understanding that underpins our ability to make the good engineering decisions that support safe and reliable mining and construction. HiveMap’s digital mapping software allows geologists and engineers to confidently interpret the information generated from these different scanning tools, and build out a detailed knowledge of the rock mass and conditions, identifying geological features and structures that may impact the design process.
By utilizing HiveMap as part of the interpretation process we can avoid exposing people to high risk areas completely, while still generating an appropriate level of knowledge about the rock exposure. This knowledge facilitates better engineering decisions, improving design, and further increasing safety across operations!
Coverage of Mapping Data
The importance of collecting a good spatial distribution of structural data through mapping cannot be overstated, and HiveMap allows geoscientists to map huge areas of – for example – open pit mines, that are inaccessible with field mapping alone.
With a well-populated dataset comes the ability to interpret and incorporate structural variability into 3D modelling efforts that support good decisions in design, and safety for our employees and operators. The understanding of variability, informed by widespread mapping coverage, will invariably translate into discussions around model uncertainty and risk. Whether that’s risk to the resource or to the geotechnical design, the wide mapping coverage facilitated by HiveMap’s digital mapping software allows us to produce more reliable models and safer operating environments.
Mapping Complexity
With increasing deposit complexity comes an increased requirement for good quality, and densely populated data inputs. An example is illustrated below, where the requirements to properly characterize foliation variability increases as the rock mass becomes more tightly folded.

HiveMap’s digital mapping software presents an efficient and intuitive way to intake the rich data types being collected remotely from photogrammetry and LiDAR, and undertake geological mapping of rock exposures that were conventionally difficult to map. With both the tablet and desktop applications, interpretations can be made in the field, at a safe distance from rock exposure, or from the comfort of the office, in collaboration with other members of the technical team. HiveMap is empowering technical staff with the ability to collect mapping information at a scale and resolution previously difficult to achieve with conventional approaches. All while reducing the risk exposure to those undertaking the mapping.
References
Saunders, E., LeRiche, A., Shapka-Fels, T., Barnett, W. 2020. Characterisation of foliated rock masses using implicit modelling to guide geotechnical domaining and slope design. International Symposium on Slope Stability in Open Pit Mining and Civil Engineering. Perth, Australia.
Stead, D & Wolter, A 2015, ‘A Critical Review of Rock Slope Failure Mechanisms: The Importance of Structural Geology’, Journal of Structural Geology, Vol. 74, pp. 1-23.
Please contact our team for additional information about our products and services
Latest news

GEOH5: A Framework for Geoscience Data and Model Portability

Mira Geoscience receives the 2023 AME Innovation Award

New release – Geoscience ANALYST 4.6

Machine learning in mineral exploration

Using Python with Geoscience ANALYST

Object’s history

Scripting

Project locks

Getting started with the Python geoh5py

Customize the Viewport axis labels
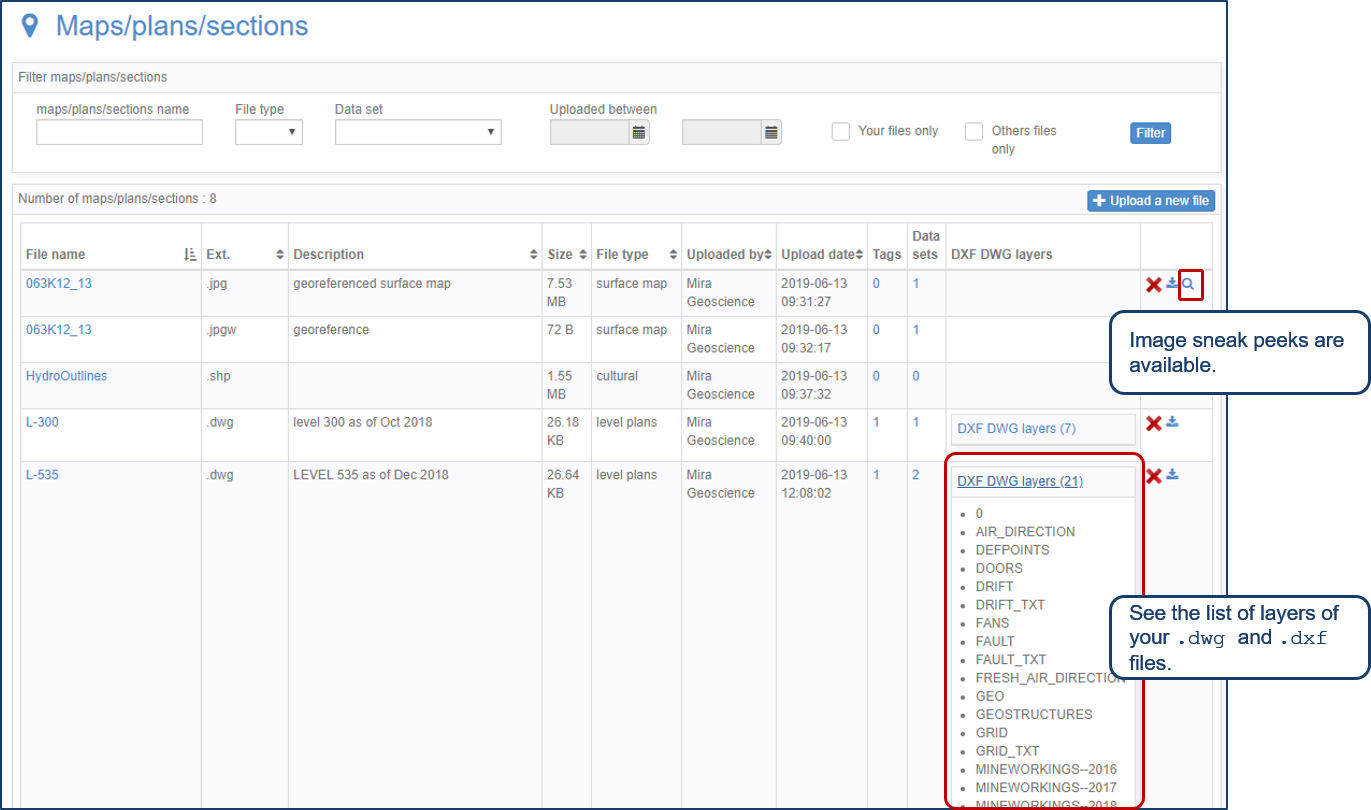
Preview files in the Maps/plans/sections page
