


One of the greatest challenges for exploration teams in remote and rugged environments is capturing detailed structural geology observations that can be integrated into downstream analysis. Often, we find ourselves on a ridge, observing the opposite mountain slope through binoculars, marveling at the exposed folds and faulting, but lacking the tools to record these observations in a practical and actionable way to inform our geological models.
Case Study: Goliath Resources and the Surebet Shear Zone
Goliath Resources was faced with these exact challenges when trying to unravel the structural complexity of their gold bearing Surebet Shear Zone, which sits within the Golddigger property, located in a remote corner of Northern British Columbia. The terrain is steep and rugged, with access to the property limited to a 30-minute helicopter ride from the historic mining town of Kitsault. The Surebet Shear Zone is exposed for more than two kilometres, with over 700 meters of steep relief which forms cliffs that stretch for more than 1.5 kilometres along the deeply incised glacial valley. In addition to the shear zone itself, the cliffs also feature well-exposed folded stratigraphy and intrusions, all of which had to be understood to unravel the structural history of the target, the controls on mineralization, and potential for other, yet to be identified, targets.
Working together, Goliath Resources, SRK Consulting, and Drone North successfully mapped this challenging area, producing a detailed and high-resolution dataset that underpins the ongoing geological work on the project.
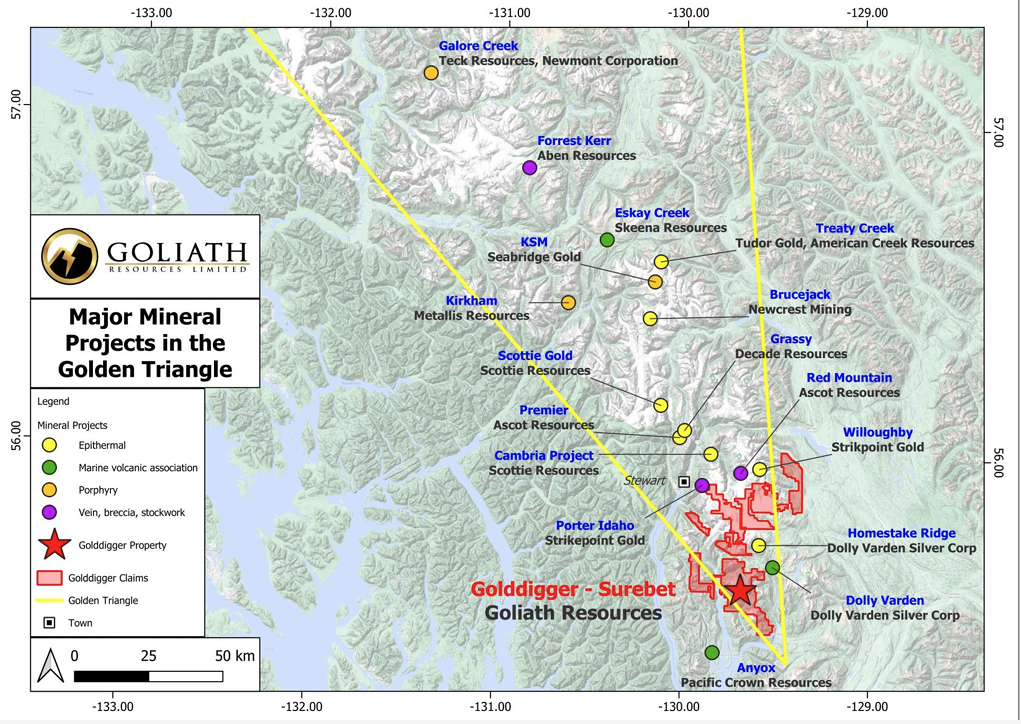
Figure 1: Location of the Golddigger Property (Goliath Resources, 2024)
Collaborative Mapping Efforts: Goliath Resources, SRK Consulting, and Drone North
Field Mapping Campaign by SRK Consulting
Ron Uken, a Principal Geologist with SRK Consulting, visited the property in the summer of 2022. He conducted field mapping to gather structural geology observations to inform future modelling. This boots-on-the-ground activity naturally focused on the accessible areas of the target area, which largely consisted of the rugged ridgelines and plateaus. Mapping was conducted using the Clino™ app on an iPad™, which was used to capture structural measurements of features such as bedding, fold axes, fold geometries, structural vergence, shear zones, brittle faults, dykes and veins. In addition to these measurements, observations on the relationships between contact porphyroblast growth and foliation, and timing relationships between shear zones were also recorded. To support the mapping in the field, an aerial photograph was loaded onto the base map in Clino™, allowing Ron to locate himself easily using the onboard GPS system. This aerial photograph allowed Ron to not only orient himself but also to trace large-scale features exposed in the landscape as he moved from outcrop to outcrop.
However, as noted above, the landscape across the target area has dramatic relief, with expansive and steep cliffs which cannot be accessed on foot. These often near-vertical cliffs provide wide exposures of the geology (they essentially form large-scale cross-sections) providing a vertical view of the geology in the subsurface, as opposed to the more or less horizontal view given by the mapping of the area immediately above. The available aerial photography was taken looking directly down, with the near vertical cliffs at a high angle to the camera, making it impossible to use them for mapping.
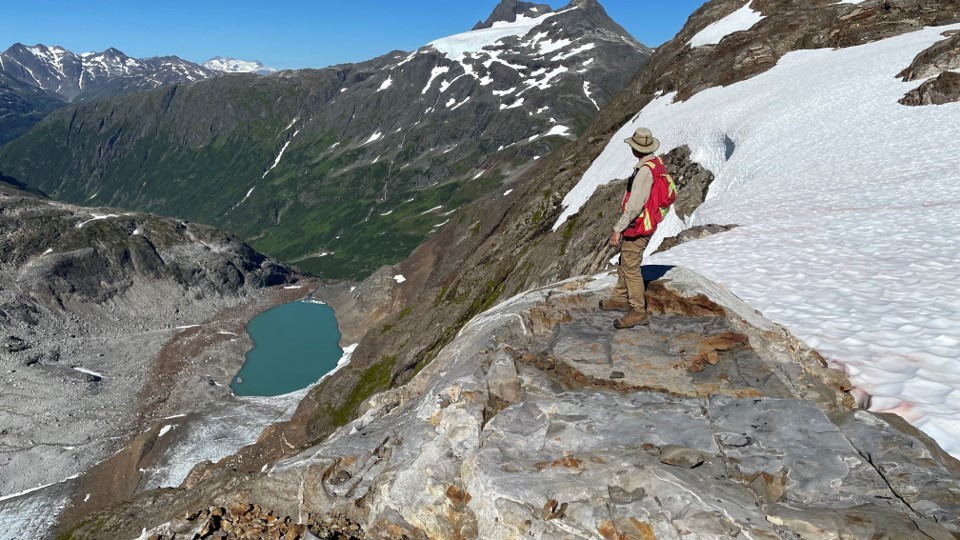
Figure 2: Geological outcrop mapping of the Surebet Shear Zone, looking down onto the steep cliff face covered by HiveMap digital mapping (Ron Uken, SRK, 2022).
Drone Surveys and Digital Mapping with HiveMap
Drone North was contracted to conduct a photogrammetry campaign using drones to image the cliff (an area of approximately 1.5km x 0.7km) in sufficient detail to allow for structural mapping. The use of drones allowed the camera to be pointed directly at the cliff face, allowing a great deal of detail not visible in aerial photography to be captured. After processing, the output was a set of 8 tiled images, each approximately 2 gigabytes in size, which clearly showed the structural features which could be seen (but not mapped) in the field.
Ron imported these high-resolution tiles into HiveMap, and built out a detailed structural interpretation of the cliff face, capturing information on the ductile deformation, defining folds and fold axes, timing relationships by looking at the cross-cutting patterns between faults, intrusions and bedding, form surfaces, as well as tracing the Surebet Shear Zone, accurately locating its contacts, continuity, and geometry.
The resulting 3D mapping interpretation generated from HiveMap provided comprehensive coverage of oriented structural data, structural features and patterns across the entire cliff face. This vertical mapping perfectly supplemented the comparatively horizontal mapping from across the ridges and plateaus, providing the opportunity to capture information in the vertical component of the target.
Mapping in both the horizontal and vertical allowed sampling of structures in two different orientations, giving a higher degree of confidence that the impact of sampling orientation bias was reduced. This also gave the opportunity to project features mapped towards the tops of the mountains with a high degree of confidence into the cliff, providing significantly more confidence than we would often have in their location and geometry in the subsequently produced 3D model.
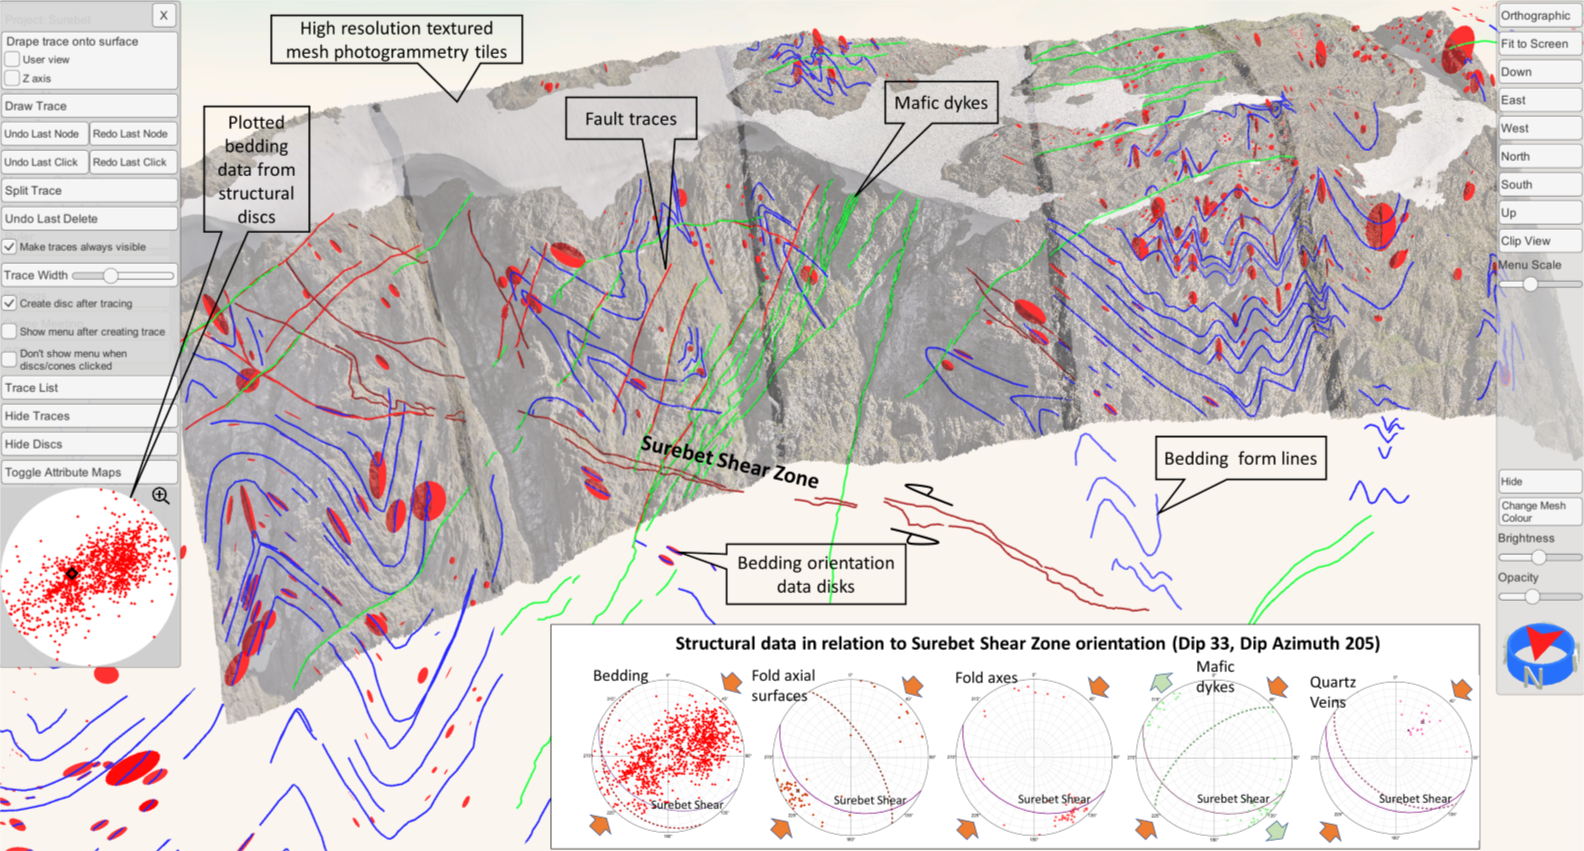
Figure 3: Geological mapping conducted in HiveMap. Note that this is an older interface which has subsequently been updated.
Results
Field mapping coupled with digital mapping in HiveMap proved to be a powerful combination of approaches when studying the Surebet Shear Zone. The patterns and features interpreted in HiveMap from the drone derived photogrammetry model could be treated with confidence, as they had been observed and their expressions across the ridges and plateaus mapped during the field campaign, really emphasizing the importance of conducting both field and digital mapping campaigns.
Although the steep terrain made mapping the cliffs impossible, HiveMap facilitated the capture of a dataset in a truly different orientation to what is possible with field mapping alone, providing a unique opportunity to map in the vertical dimension. This detailed vertical mapping went on to provide a high degree of confidence in the geometries and locations of geological features in the final 3D model that was produced, with structures projected from more horizontal field mapping into the vertical cliff faces.
HiveMap has demonstrated that not only is it a tool that performs well in the fast-paced production environment but its unique approach to digital mapping also provides significant value down to the beginning of the value chain, in exploration settings.
Please contact our team for additional information about our products and services
Latest news

GEOH5: A Framework for Geoscience Data and Model Portability

Mira Geoscience receives the 2023 AME Innovation Award

New release – Geoscience ANALYST 4.6

Machine learning in mineral exploration
Revolutionizing Subsurface Interpretation and 3D Visualization with Geoscience ANALYST Pro
VPem3D in Geoscience ANALYST Pro Geophysics

3D seismic data and survey designer tools

Using comment field entries in drillhole databases to automatically re-log lithologies

Copying objects between Workspaces

15 tips in 15 minutes

HiveMap Digital Mapping Software
