
Coffee break… and learn!
Available on our YouTube channel

In this lecture, Thomas Campagne demonstrates how to apply an isostatic correction to gravity data through a case study over central Chile. Data consists of the World Gravity map (BGI) and ground data. The isostatic response is calculated by building a crustal model using the GEMMA crustal model (Reguzzoni & Sampietro, 2015) and computing its gravity response through forward modelling. Regional trends will be accounted for, and model boundaries edge effects minimized with the implementation of model incision. Geoscience ANALYST Pro Geophysics and the VPmg inversion software offer a way forward with flexible model creation and modelling capabilities. This lecture also shows how to:

  • Build a model that explicitly represents the crust
  • Compute the gravity response of the crust
  • Incise a local model into a regional model
  • Perform a 3D inversion of gravity data

Thomas’s expertise is in geophysical interpretation for mineral explorartion. His career initially focused on supervising and conducting ground geophysical surveys including IP, TDEM, and magnetics. His systematic approach to geophysical data processing and interpretation has evolved into 3D geologically-constrained geophysical inversion and integrated geological interpretation. Thomas obtained his MSc in Geophysics from l’École et Observatoire des Sciences de la Terre Strasbourg, France. Thomas is based in Vancouver.

Latest events and news

September, 14 2020

Managing import templates

In Geoscience INTEGRATOR it is possible to edit Import template names and no-data values, activate/deactivate templates, see...
Read more
September, 16 2019

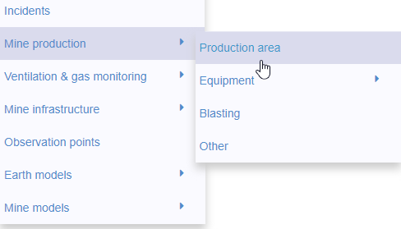
New mine production theme

In Geoscience INTEGRATOR, version 3.2 has a new theme called Production area. It’s designed for stope, mining room, or drawpoint data...
Read more
September, 13 2021

Manual classifications vs Project classifications

In Geoscience INTEGRATOR, There are two ways to create classifications when importing data...
Read more
Developer’s sandbox
June, 08 2020

Advanced drillhole planning and monitoring

We partnered with Groupe MISA to develop a low-cost 3D application where all elements of drillhole design and monitoring...
Read more
December, 01 2020

Editing property transparency

In GOCAD Mining Suite, when you select a property its transparency can be edited...
Read more
Case studies
September, 15 2025

Revolutionizing Subsurface Interpretation and 3D Visualization with Geoscience ANALYST Pro

Discover how EnBW is bridging the gap between 2D mapping, 3D seismic interpretation, and integrated geophysical workflows
Read more
Mineral systems interpretation and targeting
December, 07 2020

Using comment field entries in drillhole databases to automatically re-log lithologies

This approach uses the comment field of the logging table to extract general topics that can then be used as learning features in a supervised machine learning classification approach.
Read more
May, 11 2022

Effective date field

Geoscience INTEGRATOR v3.7 offers the Effective date upload field for files and maps...
Read more
March, 16 2020

View neighbourhoods in 3D

You can display your neighbourhoods in Geoscience INTEGRATOR 3D viewer, making it easier to understand spatial distribution of the data.
Read more
Conferences
December, 24 2025

Attending AME Roundup 2026?
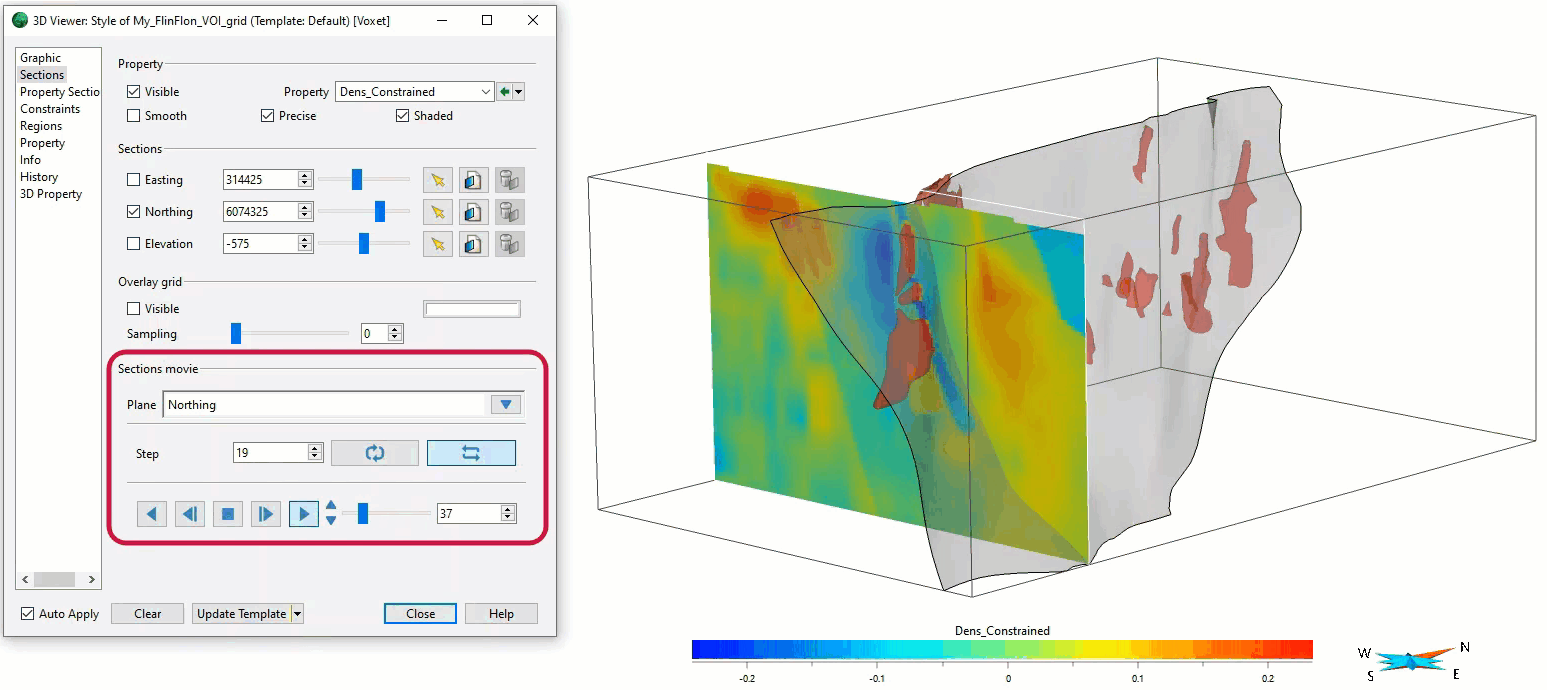
Visit us at booth 416 to see our software solutions in action and discuss your needs with our expert team!
Read more
March, 01 2021

Sections movies

In GOCAD Mining Suite, you can create a section animation by specifying which section plane you want to visualize...
Read more
February, 10 2021

Property value range

In Geoscience INTEGRATOR, You can refer to the range of values in the query panel to apply numeric property filters...
Read more

Please contact our team for additional information about our products and services