



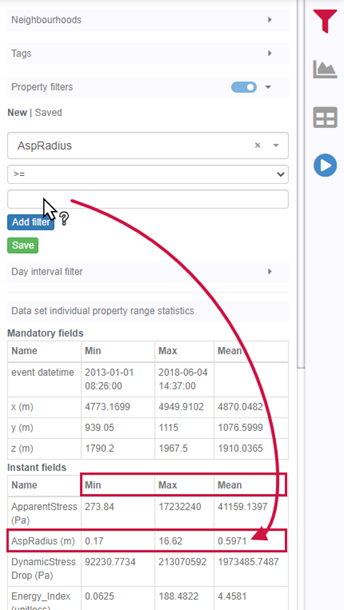
When querying from the Data set explorer or the Samples compilation and applying property filters to numeric properties, you can refer to the range of values in the table at the bottom of the query panel to see the minimum, maximum, and mean values of each property.
Previous tips can be found under the Software tip category in the News section and in the Archives section of our website.
Latest news

New Visual Parameter – Contours
In Geoscience ANALYST you can visualize contours on 2D grids. Select your data, specify the contour parameters, or change the colour.
..

Filtering data by neighbourhood
In the web UI, you can rapidly filter your data by neighbourhoods and display it in plots, charts, or tables.

25 years modelling the earth together
Dedicated to driving technological innovation and excellence in the realm of geoscience. Your success is at the heart of everything we do.

Getting started with the Python geoh5py
Past event, view here or via our YouTube channel...

3D seismic data
In Geoscience ANALYST you can import and visualize 3D seismic data, and plan your next seismic survey with the seismic reflection survey designer....

Viewing data from report items
In Geoscience INTEGRATOR table and chart items from ad-hoc or scheduled reports can be easily refreshed, using the same filters that were applied in the original report, to display current data.

Search for data by spatial extent
This video shows you how to search for data from Geoscience INTEGRATOR by spatial extent...

VPmg, VPem1D and VPutility release
VP Geophysics Suite releases: VPmg version 9.3, VPem1D version 4.3 and VPutility version 1.2...

Reopening selected commands
In GOCAD Mining Suite the Log and Command Messages panel has a new tool to reopen previously executed commands...

R&D projects in data management
Over the past couple of years we have been developing skills and technology in practical, business-focused data management as a solid foundation for modelling, analysis, and interpretation.

Coordinate display area
In Geoscience ANALYST you can get real-time feedback on the XYZ coordinates corresponding to the...
..
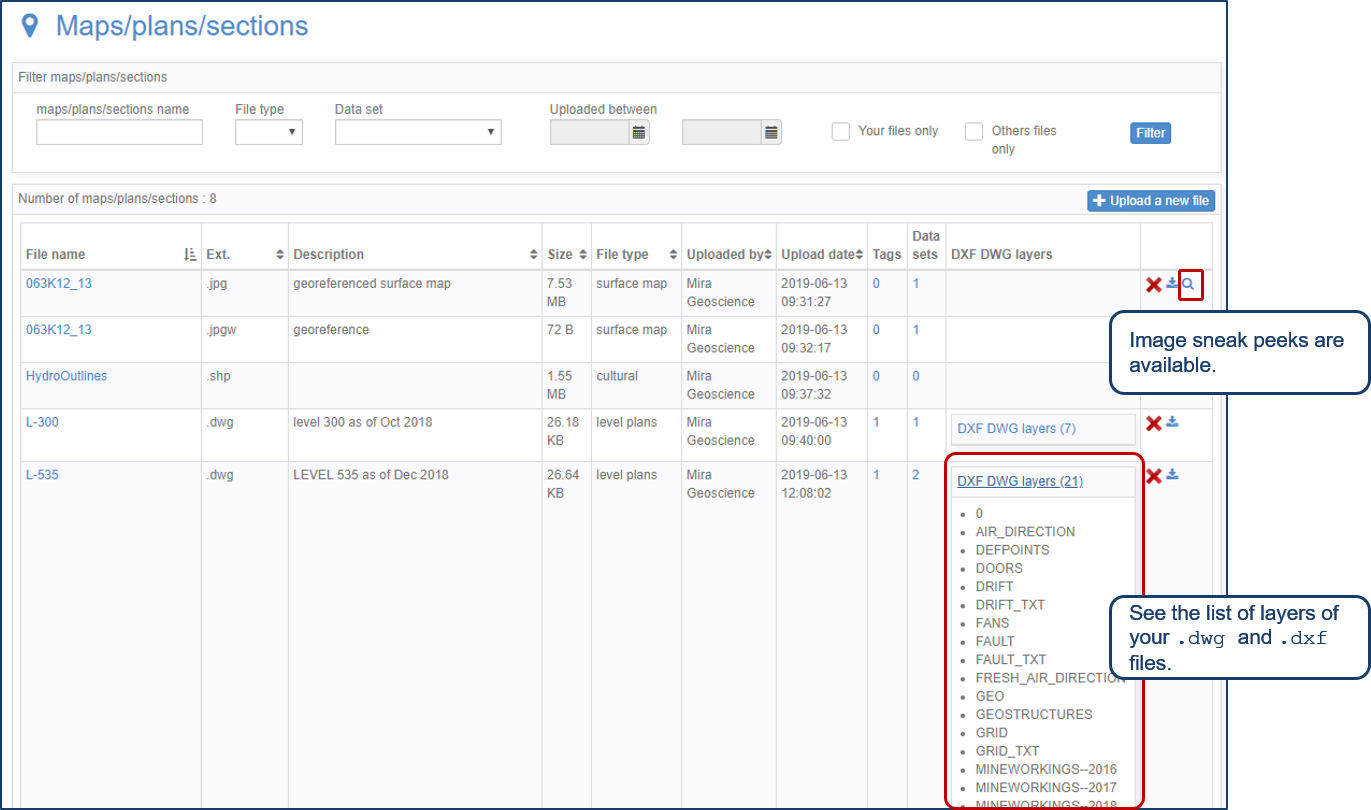
Preview files in the Maps/plans/sections page
See the list of layers of your .dwg and .dxf files. Image sneak peeks are also available...