


In GOCAD Mining Suite’s next update, v19u2, connectivity with Geoscience ANALYST’s workspace is more efficient with direct import of geoh5 files.

With this ability to both import and export geoh5, you can seamlessly go between GOCAD Mining Suite and Geoscience ANALYST. The Visual Parameters and Viewport settings are preserved and the object tree is replicated as lists in the Lists browser.
Previous tips can be found under the Software tip category in the News section and in the Archives section of our website.
Latest news
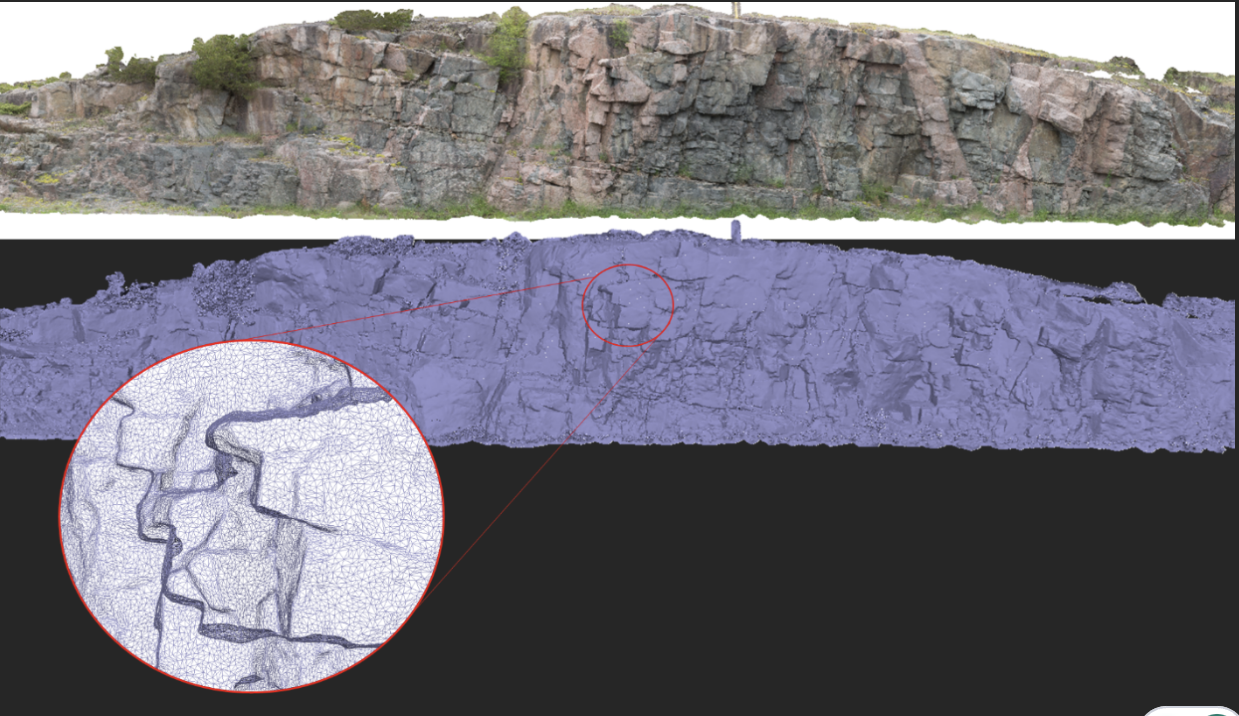
Creating Mappable Surfaces
Capture geological observations quickly, safely, and accurately, both in the field and office with HiveMap...
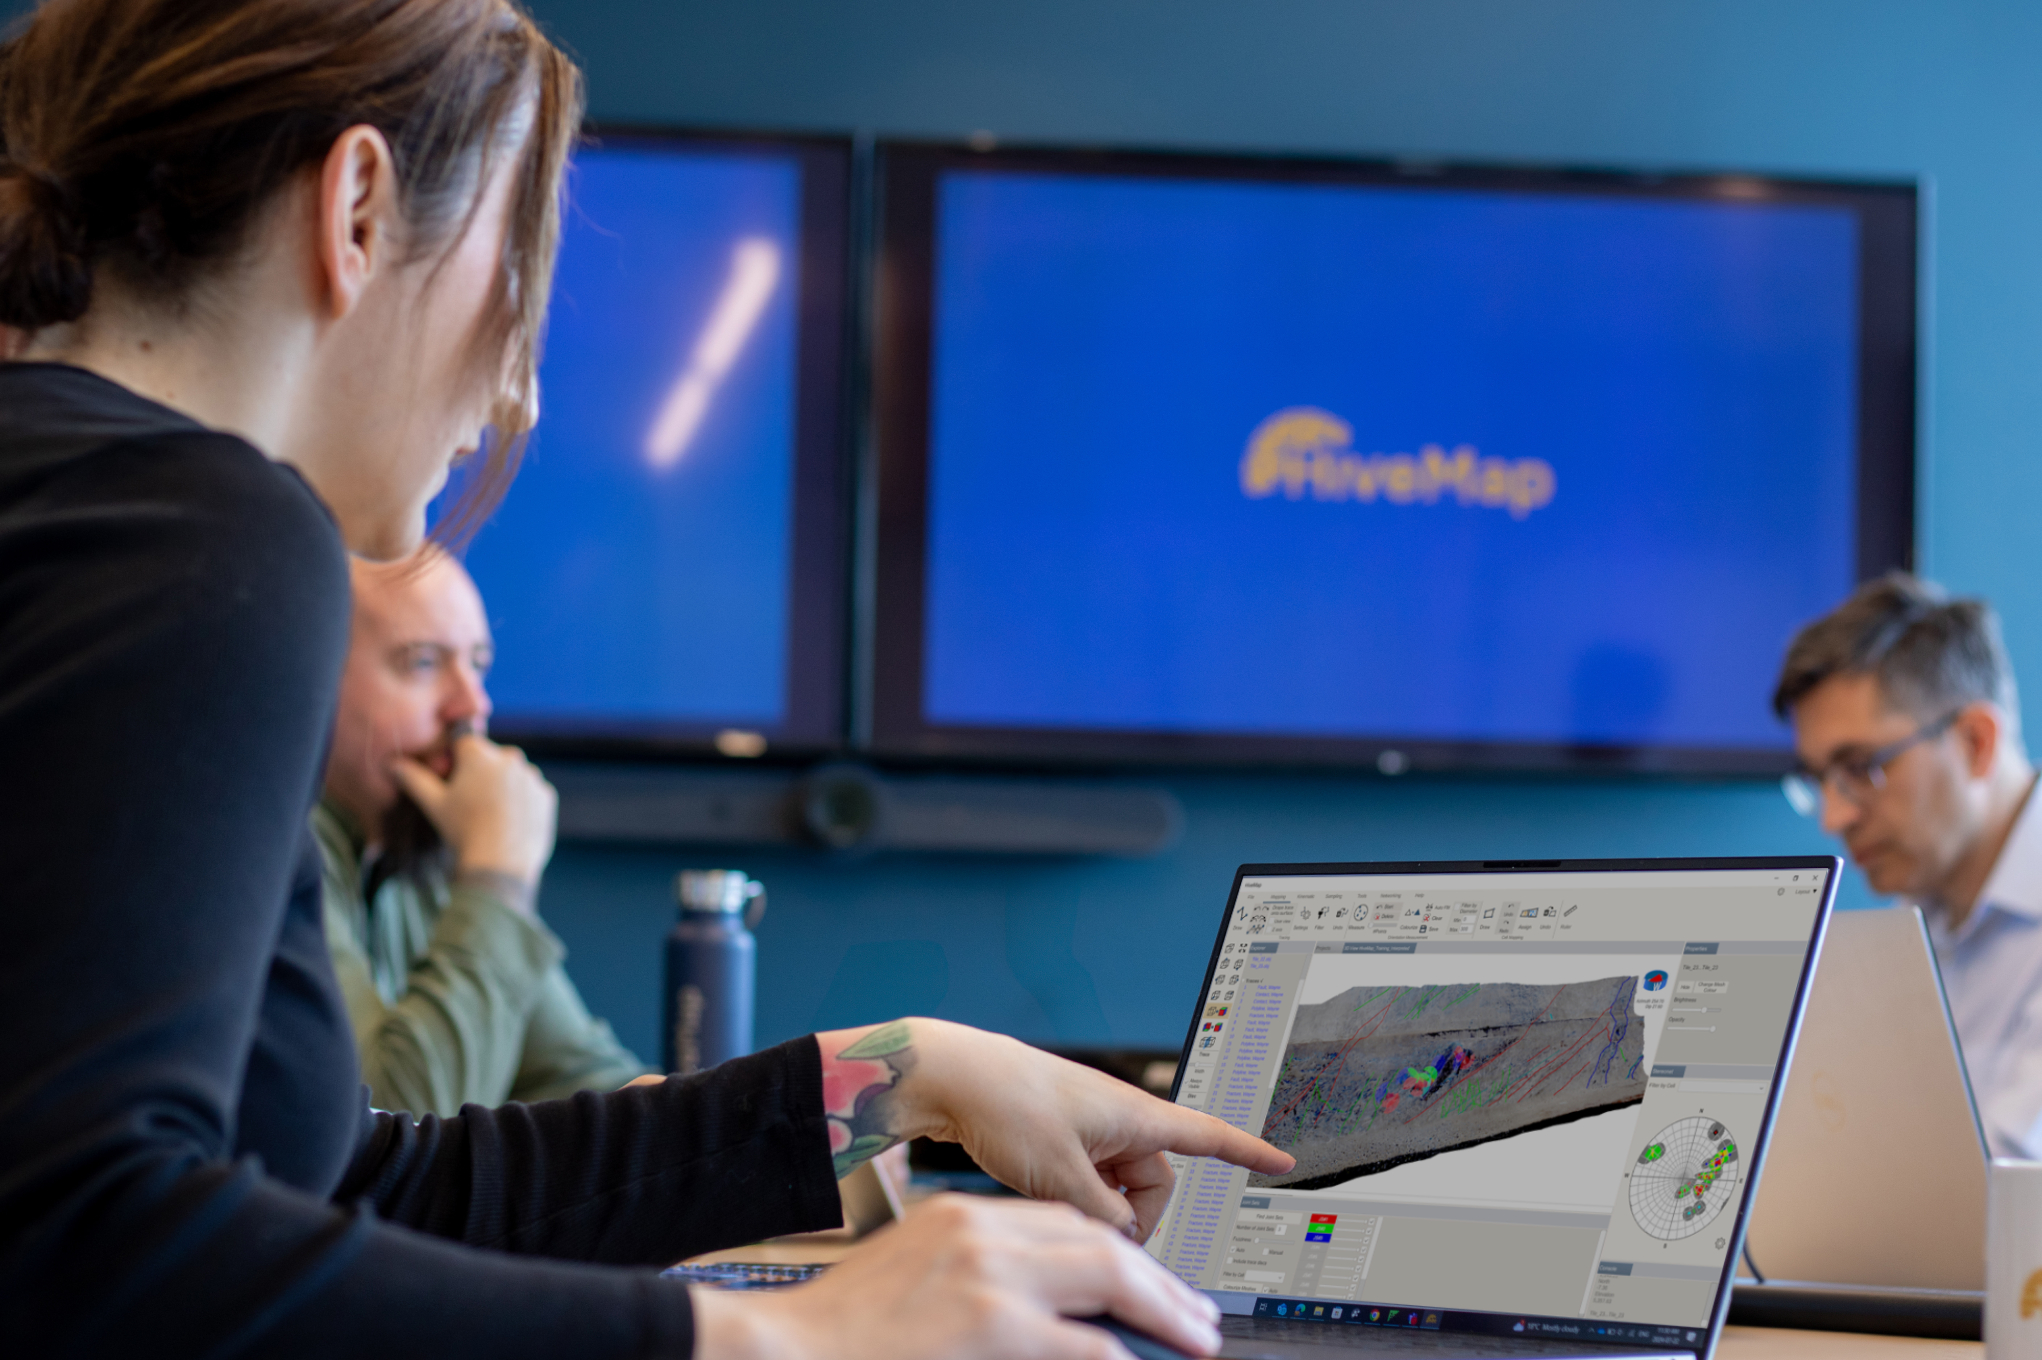
Introducing HiveMap
Capture geological observations quickly, safely, and accurately, both in the field and office with HiveMap...

Customize the Viewport axis labels
In Geoscience ANALYST you can customize the Viewport axis labels
..

Scripting – Geoscience ANALYST Pro – Virtual Lecture
Past event. Have a look at the video to learn about mathematical and logical scripting in Geoscience ANALYST Pro...

Earth model’s themes are renamed
In Geoscience INTEGRATOR v3.7, the “Earth models” theme group is renamed “Models, maps and sections” and the theme’s names were...

Monitoring folders
Geoscience INTEGRATOR's monitoring folders can be used to automatically import files to a project to save time and streamline regular updates.

New release – Geoscience ANALYST 4.7
Geoscience ANALYST 4.7 delivers a significant set of new tools and performance enhancements. Download it now!

Macros
In GOCAD Mining Suite you can save lots of time with SKUA-GOCAD’s macros, a built-in scripting tool in which you can record or enter a sequence of commands to carry out or repeat at any time...

DC resistivity inversion in Geoscience ANALYST Pro Geophysics
Past event, view here or via our YouTube channel...

Reopening selected commands
In GOCAD Mining Suite the Log and Command Messages panel has a new tool to reopen previously executed commands...

Using comment field entries in drillhole databases to automatically re-log lithologies
This approach uses the comment field of the logging table to extract general topics that can then be used as learning features in a supervised machine learning classification approach.

Rapid and accurate mapping
We explain how automated generation of alteration maps using radiometric data is well-suited to large-footprint mineral systems...