


The Coordinate Display Area, located at the bottom of the interface, provides real-time feedback on the XYZ coordinates corresponding to the mouse movements and the Viewport’s camera dip and dip direction parameters. When you left-click anywhere in the Viewport, the coordinates remain displayed until you click again.

Drillhole name and wireline depth also appear in this area.
Previous tips can be found under the Software tip category in our News page and in our Archives page.
Latest news

Custom discrete colour scales
Geoscience INTEGRATOR allows you to build and display custom colour scales when making a scatter plot or...

Block model volume
In Geoscience ANALYST you can visualize your block model data by volume in the Visual Parameters panel...
..

Upload global descriptions
In Geoscience INTEGRATOR, add an editable global description during import to save time and reduce errors...
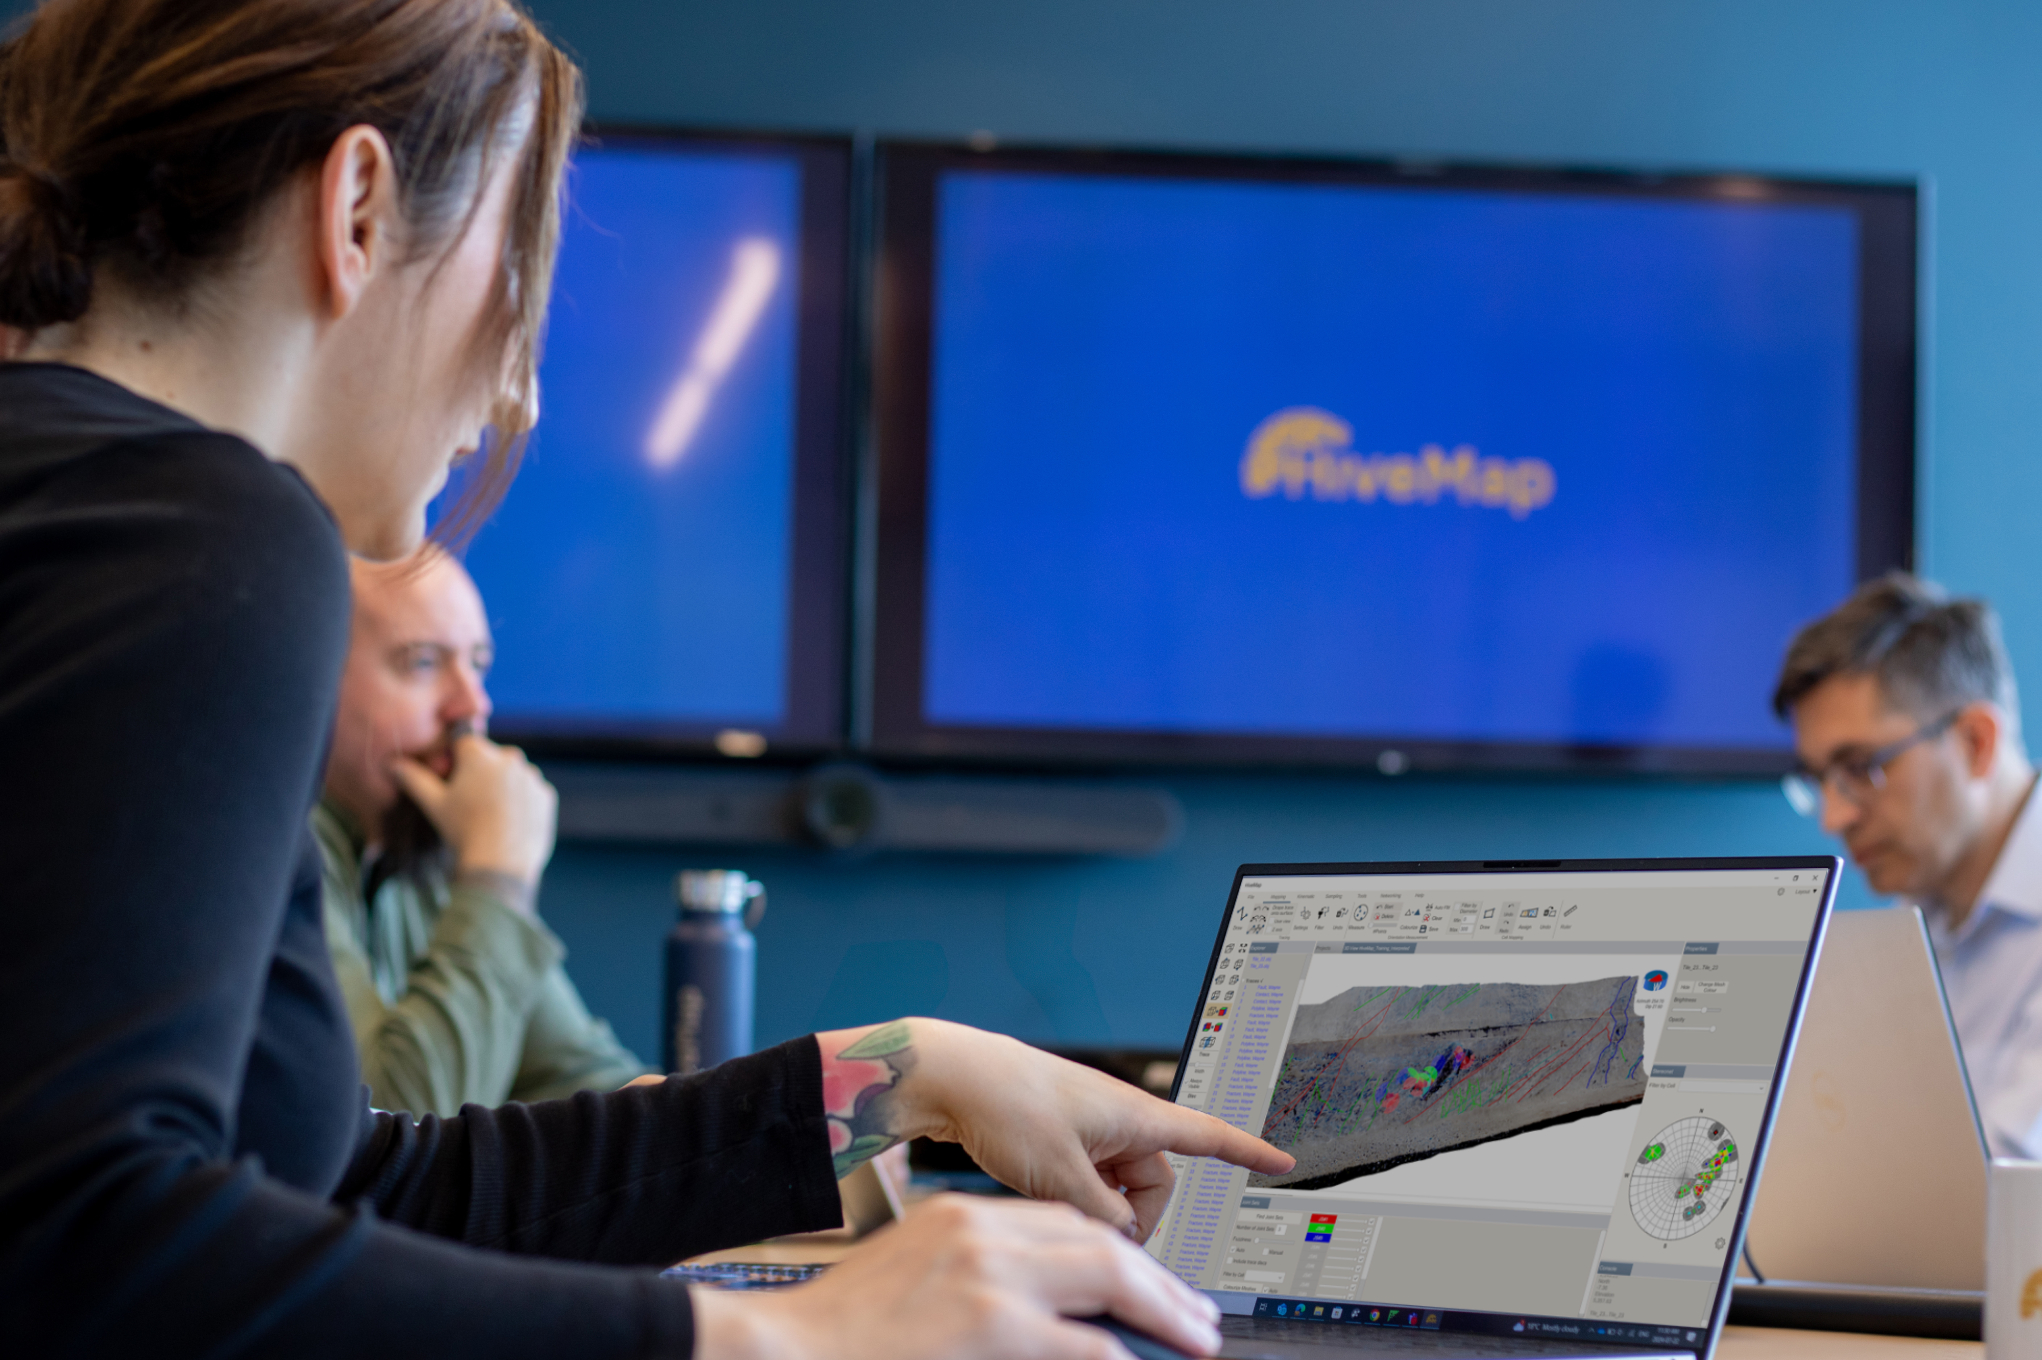
Introducing HiveMap
Capture geological observations quickly, safely, and accurately, both in the field and office with HiveMap...

Used v/s available themes
In Geoscience INTEGRATOR, the Theme drop down menu shows a filtered list of those containing data sets by default...

Search for data by spatial extent
This video shows you how to search for data from Geoscience INTEGRATOR by spatial extent...

Reopening selected commands
In GOCAD Mining Suite the Log and Command Messages panel has a new tool to reopen previously executed commands...

Mira Geoscience Partners with Tessael to Advance Geological Modelling in Geoscience ANALYST
Capture geological observations quickly, safely, and accurately, both in the field and office with HiveMap...

Inverting time domain data in Geoscience ANALYST version 4.0 – Virtual Lecture
Kristofer inverts TEM data in 1D through Geoscience ANALYST Pro Geophysics to recover conductivity in Geoscience ANALYST 4.0...

Improved data analysis
Analyze your data with enhanced histogram display options available in GOCAD Mining Suite v19...

Themes
Geoscience INTEGRATOR v3.5 and Geoscience ANALYST v3.2 include new themes and renamed ones to help you to locate data in a more intuitive way.

Using magnetic susceptibility measurements to define mineral exploration targets
Combining magnetic survey data with measured drillcore susceptibility data greatly increases the resolution and geometrical accuracy of the magnetic inversion...