


The normal of a surface is an example of a 3D vectorial property, where the components of the vector are defined by x, y, and z.
To visualize an object’s 3D vectorial property:
- Open the object’s Style Editor > 3D Property.
- Select Visible and choose the 3D property as a variable.
- Optionally, Arrow style and Rescale can be helpful for visualizing 3D properties.
3D properties can be created manually through scripts or via commands like Compute Distance to Object or Compute Distance to Nearest Neighbour.

Previous tips can be found under the Software tip category in the Resources section and in the Archives section of our website.
Latest news

Reshape using spiderwebs
GOCAD Mining Suite v19 allows you to reshape your surfaces and 2D Grids with a spiderweb editing tool...

3D seismic data and survey designer tools
Coming soon to Geoscience ANALYST, tools for hard rock seismic...
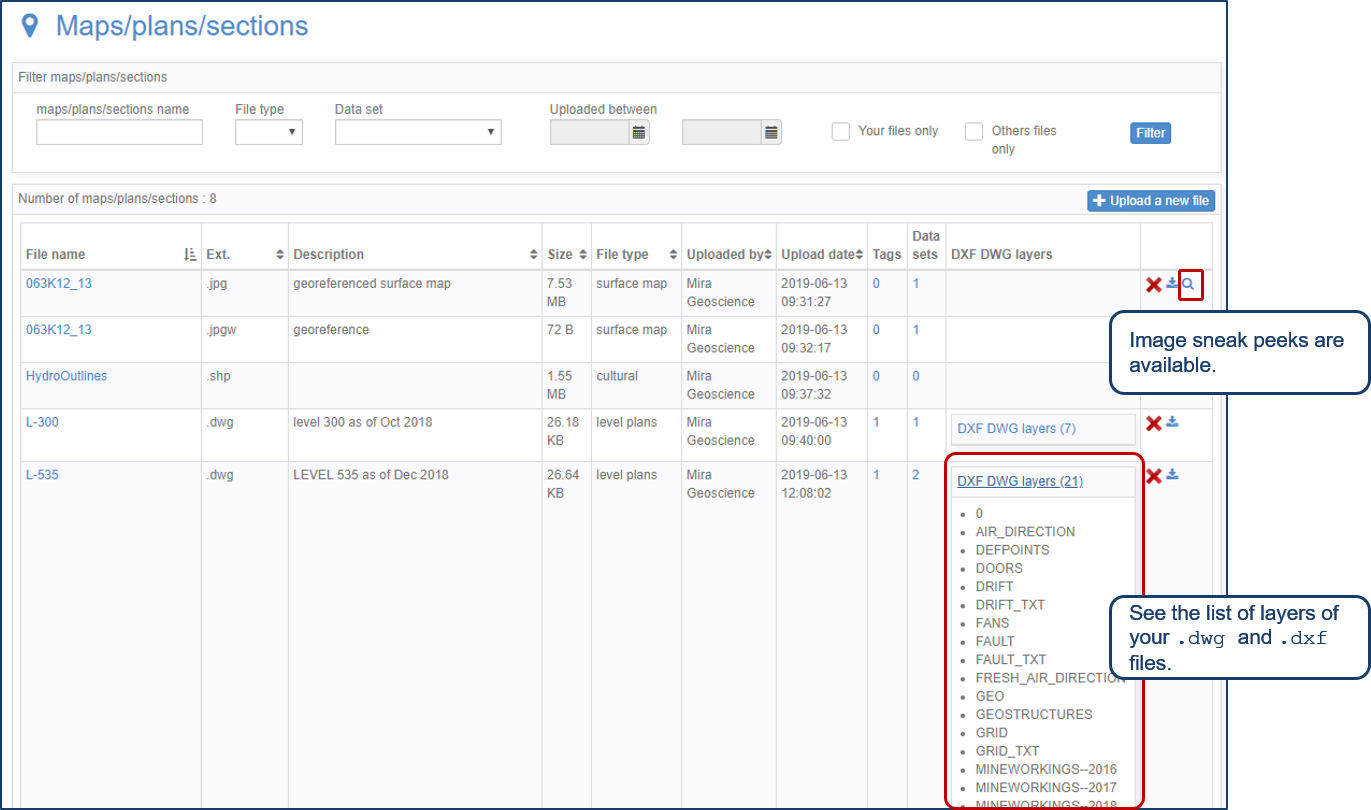
Preview files in the Maps/plans/sections page
See the list of layers of your .dwg and .dxf files. Image sneak peeks are also available...

Coordinate system transformations
In Geoscience ANALYST Pro version 4.0, you can apply coordinate system transformations to...

R&D projects in data management
Over the past couple of years we have been developing skills and technology in practical, business-focused data management as a solid foundation for modelling, analysis, and interpretation.

Using comment field entries in drillhole databases to automatically re-log lithologies
This approach uses the comment field of the logging table to extract general topics that can then be used as learning features in a supervised machine learning classification approach.

GEOH5: A Framework for Geoscience Data and Model Portability
Used by thousands, GEOH5 is the open-source data structure that is taking down the interoperability barriers and revolutionizing...

Tagging query results
In Geoscience INTEGRATOR, this allows you to rapidly access that subset of objects. Instead of having to search and select multiple filters every time...
New release – Geoscience INTEGRATOR 4.3
Geoscience INTEGRATOR 4.3 introduces exciting new features to help you manage your data more efficiently and streamline your workflow

The value of using structural restoration tools in exploration modelling – Virtual Lecture
Watch recording - Jean-Philippe shows the use of structural restoration tools in GMS as a modelling tool for structurally controlled deposits...

Drape Voxet properties on surfaces
In GOCAD Mining Suite you can texturally drape your images and 2D gridded data onto surfaces, for example...

Editing file settings
In Geoscience INTEGRATOR version 3.4, users will be able to edit their files’ settings...