



Want to highlight the contact between two geological units in your drillhole data? Using the geological 3D-GIS query you can create points at specific geological contacts. These are especially useful for the construction of your geological contact surface.

You can also create points at the top, middle, or bottom of an interesting geological unit and restrict your search to a specific interval. For example, create a point at the middle of the first occurrence of your mineralized horizon that is greater than 10m in length.
Previous tips can be found under the Software tip category in the News section and in the Archives section of our website.
Latest news

Editing property’s colormap
In GOCAD Mining Suite, when you select a property its colormap can be edited...
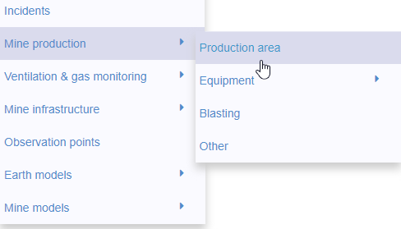
New mine production theme
In Geoscience INTEGRATOR, version 3.2 has a new theme called Production area. It’s designed for stope, mining room, or drawpoint data...

Filtering samples by their drillhole
In Geoscience INTEGRATOR, you can can filter them according to the drillhole they are located in...

New release – Geoscience ANALYST 4.6
Geoscience ANALYST 4.6 brings performance improvements and key new features to all modules. Download it now!

Managing import templates
In Geoscience INTEGRATOR it is possible to edit Import template names and no-data values, activate/deactivate templates, see...
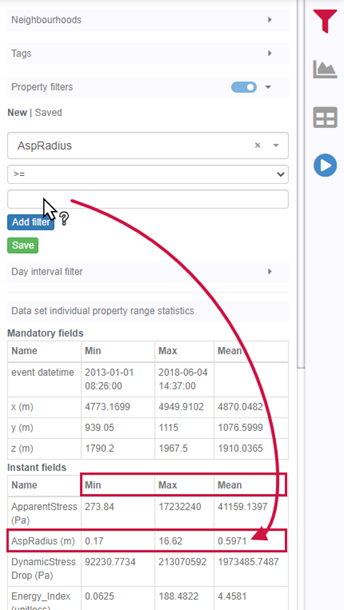
Property value range
In Geoscience INTEGRATOR, You can refer to the range of values in the query panel to apply numeric property filters...
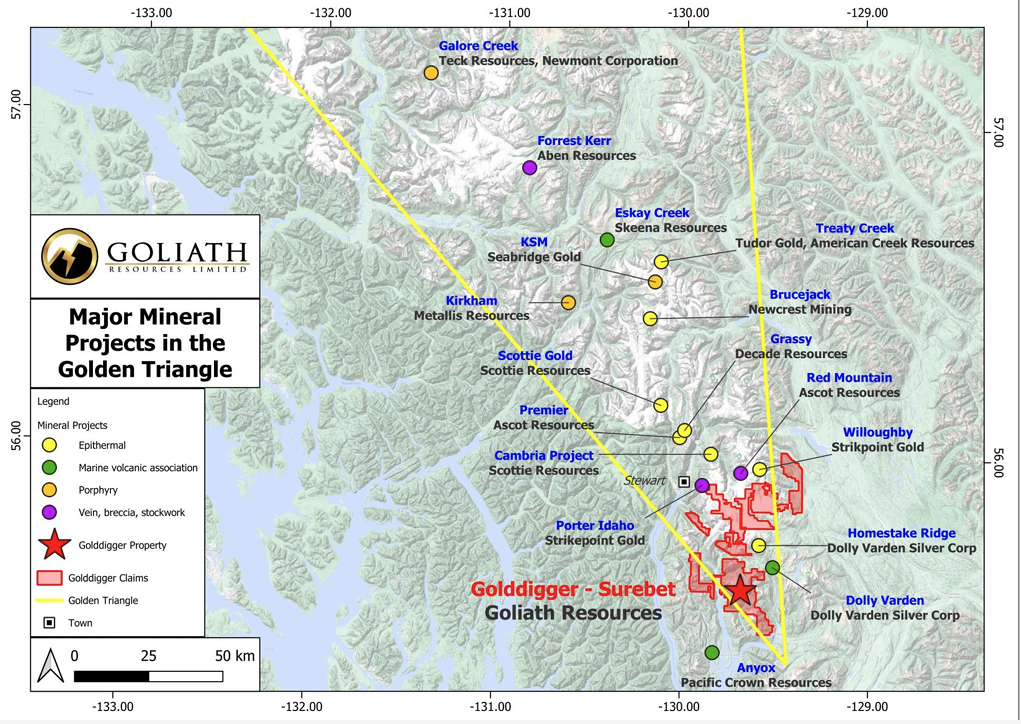
Remote Structural Mapping: A case study from the Golddigger property, BC
Capture geological observations quickly, safely, and accurately, both in the field and office with HiveMap...

A robust workflow for regional porphyry targeting; Application to the QUEST-South project area in southern British Columbia
Mitigating data science and statistical challenges is crucial to integrate machine learning into the everyday targeting tasks of exploration geologists.

VPmg, VPem1D and VPutility release
VP Geophysics Suite releases: VPmg version 9.3, VPem1D version 4.3 and VPutility version 1.2...

Plotting drillhole data
While pencil crayons are still a vital part of geology, Geoscience ANALYST lets you get all your data into 3D in a convenient shareable format...

15 tips in 15 minutes
15 Geoscience ANALYST tips on advanced visualization and knowledge sharing...

Show and hide
In Geoscience ANALYST you can show and hide everything, individual objects, container groups or drillhole groups...