


You can quickly hide everything that is visible in the Viewport by right-clicking on Workspace in the Objects panel and selecting Hide All.

You can show and hide individual objects through the Objects panel or by accessing their contextual menus in the Viewport and selecting View Only or Hide.

You can also right-click on Container Groups and Drillholes to View All, View Only, or Hide All.

Previous tips can be found under the Software tip category in our News page and in our Archives page. Join our Virtual Lecture series that showcases technological advancements and provides quick tutorials on Geoscience ANALYST features. More details about this series on our Events page or sign-up to the mailing list.
Latest news

Python applications for geoscientific problems
geoh5py and geoapps - Open format, open source code, and open licensed data! Cannot get any better than that!

3D drillhole design and monitoring in Geoscience ANALYST Pro v4.0 – Virtual Lecture
Jennifer shows the new and updated drillhole design and monitoring tools in Geoscience ANALYST 4.0...
VPem3D in Geoscience ANALYST Pro Geophysics
Accelerating 3D TEM Interpretation with and without Geological Constraints. Read more >>

Mira Geoscience receives the 2023 AME Innovation Award
John McGaughey, Mira Geoscience's President, has been selected for the 2023 AME Innovation Award for leading the development of GEOH5.
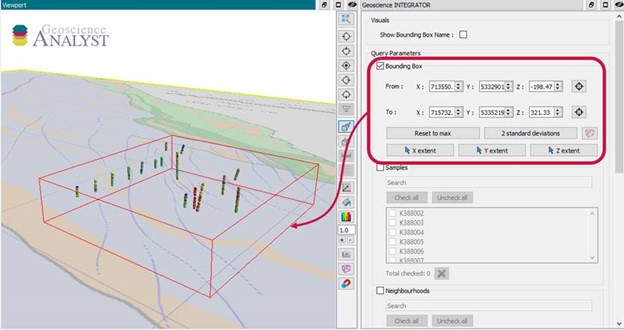
Automatic calculation of XYZ for drillhole sample location
In Geoscience INTEGRATOR, drillhole sample locations are automatically computed as XYZ by the system from the deviation surveys...

Let the data speak!
Four years ago, along with DMT Group, we started working with JSC Apatit on their Kirovski and Rasvumchorr mines that...

Copying objects between Workspaces
In Geoscience ANALYST objects can be copied from one Workspace to another by using Ctrl+C and Ctrl+V...

Used v/s available themes
In Geoscience INTEGRATOR, the Theme drop down menu shows a filtered list of those containing data sets by default...

Q&A: Revival Gold Inc.
We discussed Mira Geoscience’s contribution to further understand the Beartrack-Arnett gold project area using modern exploration techniques...