


Wondering how many nodes or triangles your Surface object consists of? Access this information, and more, by right-clicking on the object > Style Editor > Info.


The information reported is different for each object type, for example Curves report the number of nodes and segments, while Voxets report the number of cells and cell spacing.
The Style Editor also contains all the settings available for changing the visual appearance of objects, property display options, region settings, and much more!
Previous GOCAD Mining Suite tips can be found under the Software tip category in the Resources section and in the Archives section of our website.
Latest news

Using ioGAS in Geoscience ANALYST Pro – Virtual Lecture
Past event, recording available here...

3D drillhole design and monitoring in Geoscience ANALYST Pro v4.0 – Virtual Lecture
Jennifer shows the new and updated drillhole design and monitoring tools in Geoscience ANALYST 4.0...

EM101: Tips and tricks for EM data in Geoscience ANALYST
In 20 minutes, James Reid show's you EM101 using Geoscience ANALYST Pro, a low-cost...
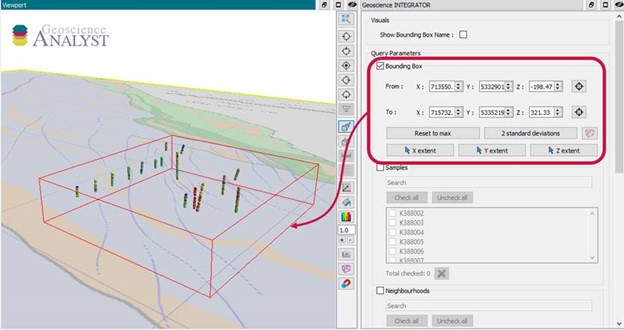
Automatic calculation of XYZ for drillhole sample location
In Geoscience INTEGRATOR, drillhole sample locations are automatically computed as XYZ by the system from the deviation surveys...

Depth-to-basement inversion using geometry and homogeneous VPmg inversion
Past event - View here or on our YouTube channel...

Q&A: Revival Gold Inc.
We discussed Mira Geoscience’s contribution to further understand the Beartrack-Arnett gold project area using modern exploration techniques...

Drillhole data interpretation – Geoscience ANALYST free viewer and Python
Past event, link to the recording is available here...

Crustal scale gravity modelling and isostatic correction over central Chile
View recording - Thomas demonstrates how to apply an isostatic correction to gravity data through a case study over central Chile using...

Peak finder – Geoscience ANALYST geoapps: Python application
Past event. Link to recording available here.

UBC-GIF or VP Suite inversion?
"The programs are complementary, and the combination gives one the ultimate flexibility in potential-field inversion,” says Kristofer Davis, Scientific Programmer at Mira Geoscience.

Editing property’s colormap
In GOCAD Mining Suite, when you select a property its colormap can be edited...

DC resistivity inversion in Geoscience ANALYST Pro Geophysics
Past event, view here or via our YouTube channel...