



This video will show you how to search and import data from Geoscience INTEGRATOR data management system using the bounding box feature in Geoscience ANALYST. It is not a step-by-step “how to” per se but shows what can be achieved in a fluid overview. More details on how to take full advantage of this search option is available in the User guide.
Previous tips can be found under the Software tip category in the News section and in the Archives section of our website.
Latest news

Used v/s available themes
In Geoscience INTEGRATOR, the Theme drop down menu shows a filtered list of those containing data sets by default...

Filtering samples by their drillhole
In Geoscience INTEGRATOR, you can can filter them according to the drillhole they are located in...

Peak finder – Geoscience ANALYST geoapps: Python application
Past event. Link to recording available here.

New release – Geoscience INTEGRATOR 4.2
Geoscience INTEGRATOR 4.2 unveils a range of new features and improvements designed to boost performance and enhance user experience.

Tagging query results
In Geoscience INTEGRATOR, this allows you to rapidly access that subset of objects. Instead of having to search and select multiple filters every time...

What’s new in Geoscience ANALYST version 4.0 – Virtual Lecture
Watch as Carla shows the new and updated tools in Geoscience ANALYST 4.0...

Importing objects from project
In GOCAD Mining Suite you can easily import objects from one GOCAD project to another by...
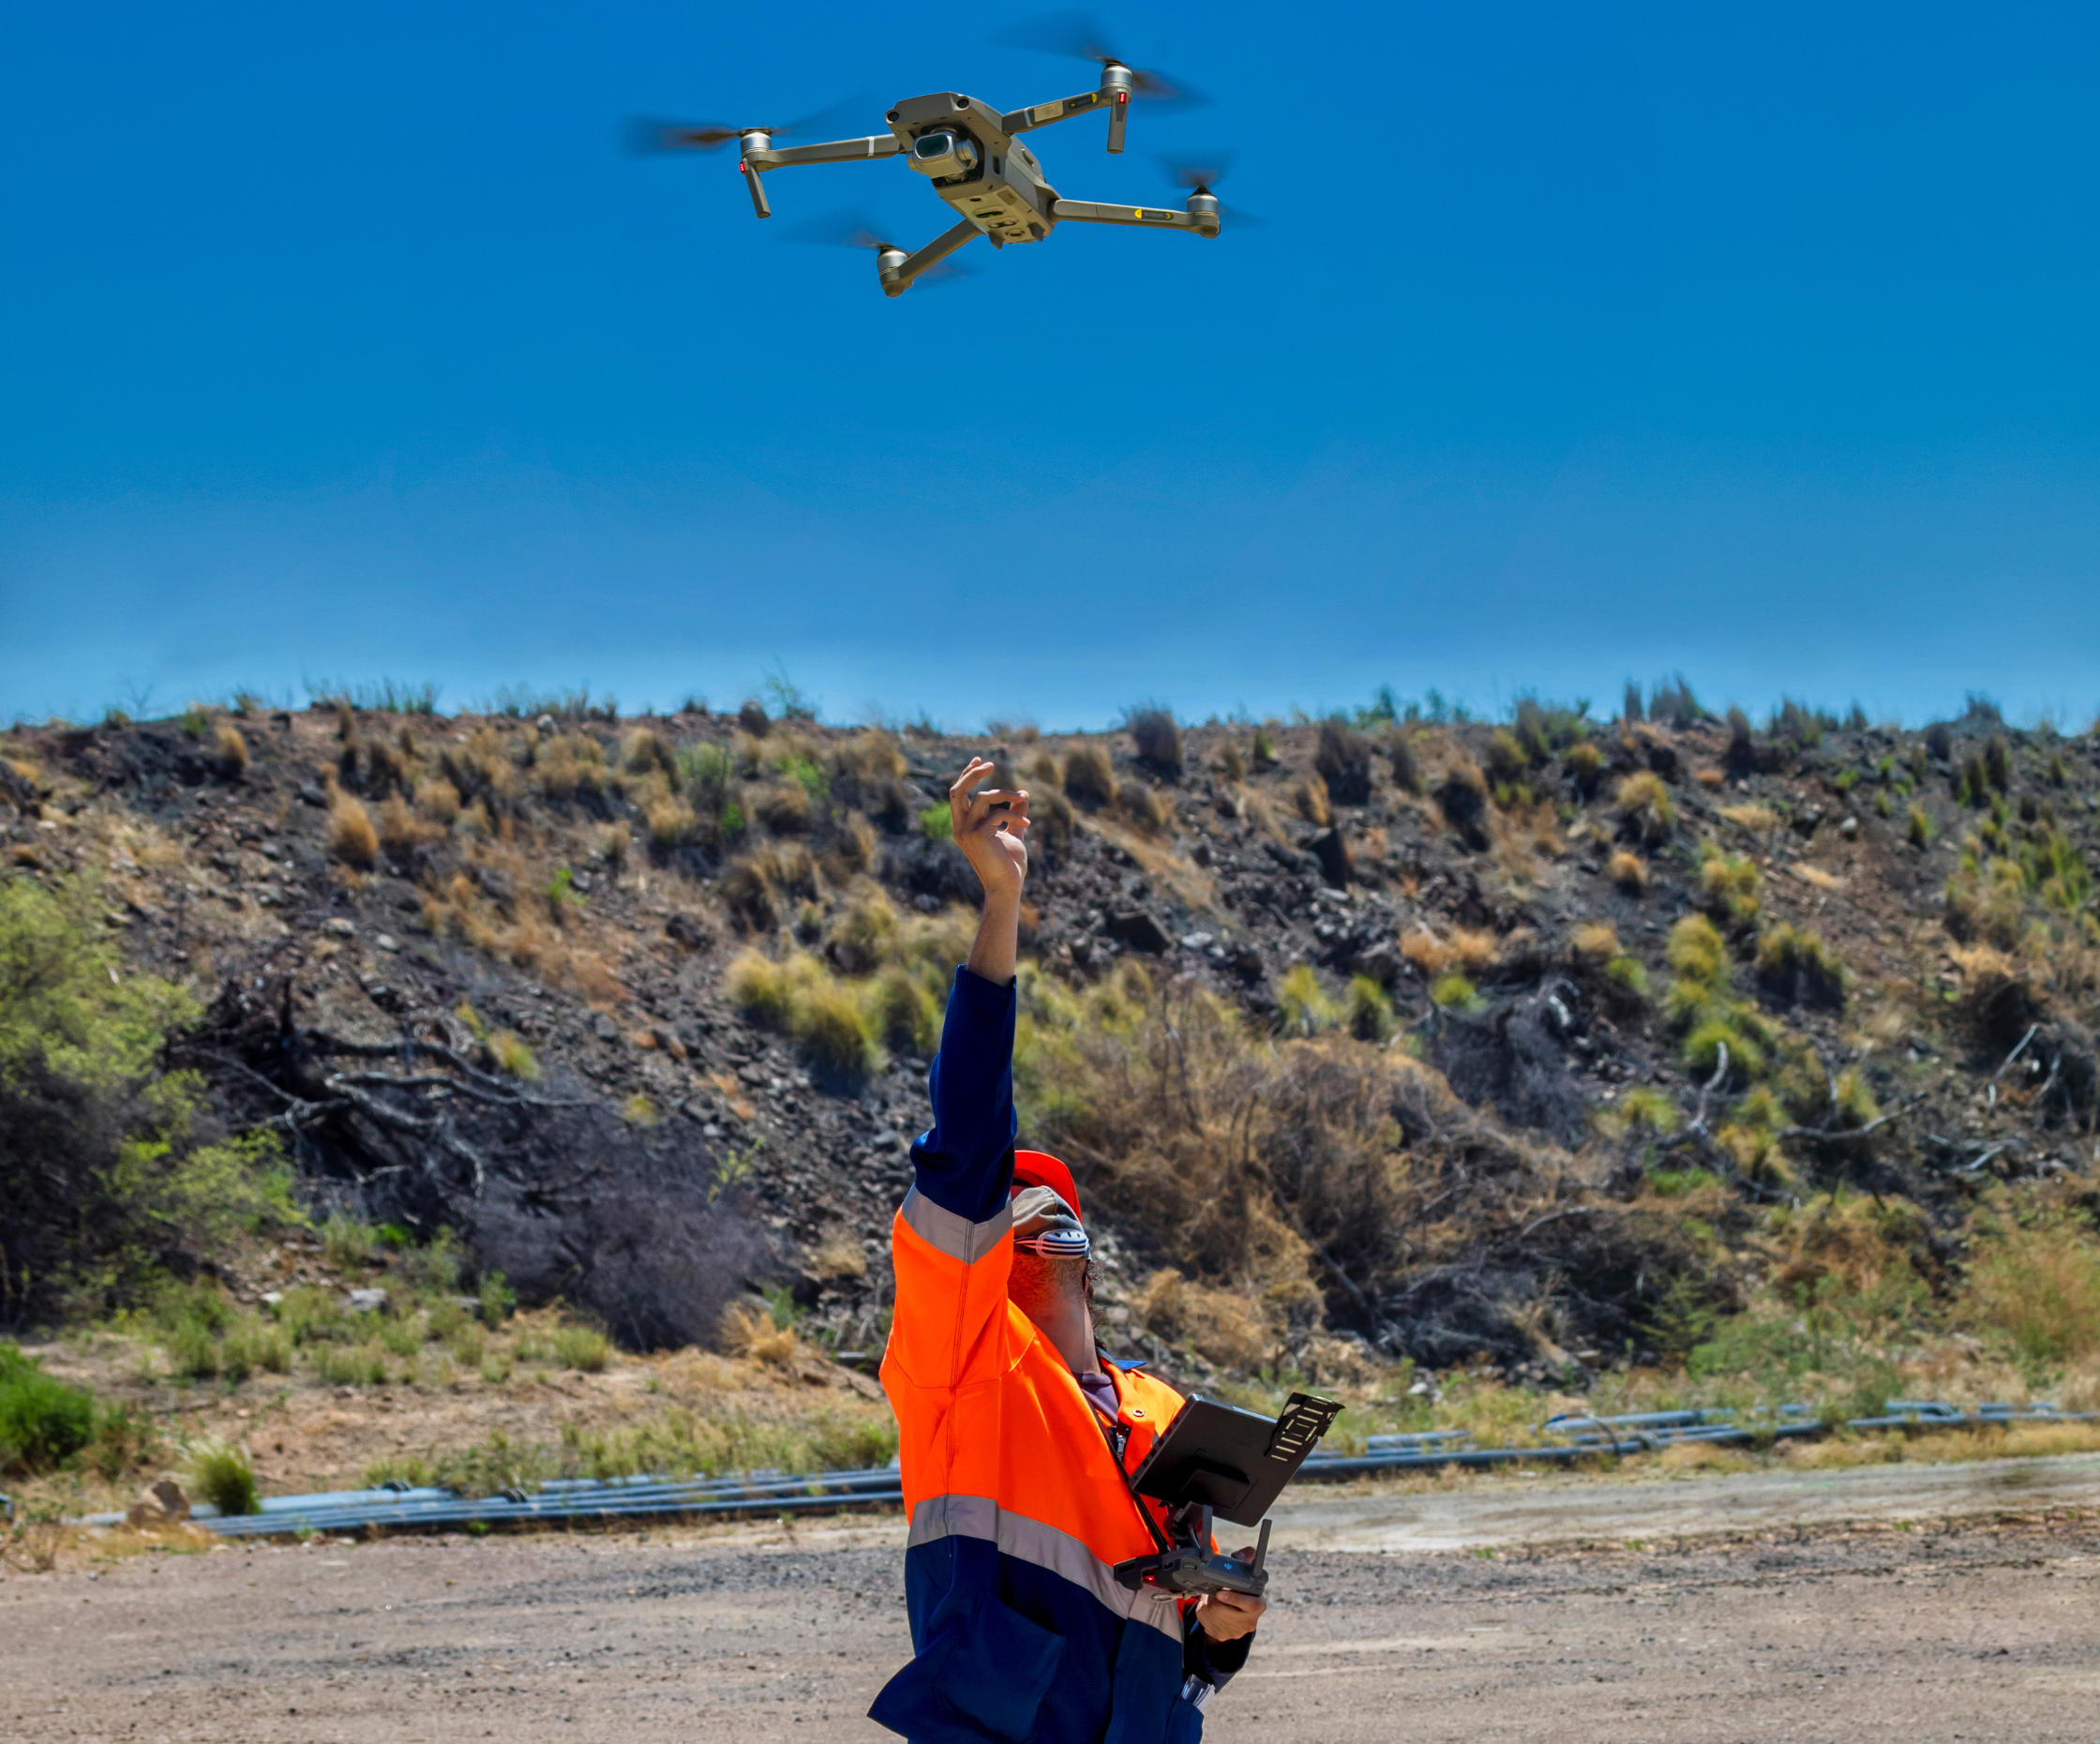
Creating Digital Models of Rock Exposure for Geological and Geotechnical Mapping
Capture geological observations quickly, safely, and accurately, both in the field and office with HiveMap...

Pointer Tracking
In GOCAD Mining Suite you can take advantage of the Pointer Tracking view to track coordinates, objects, and properties.
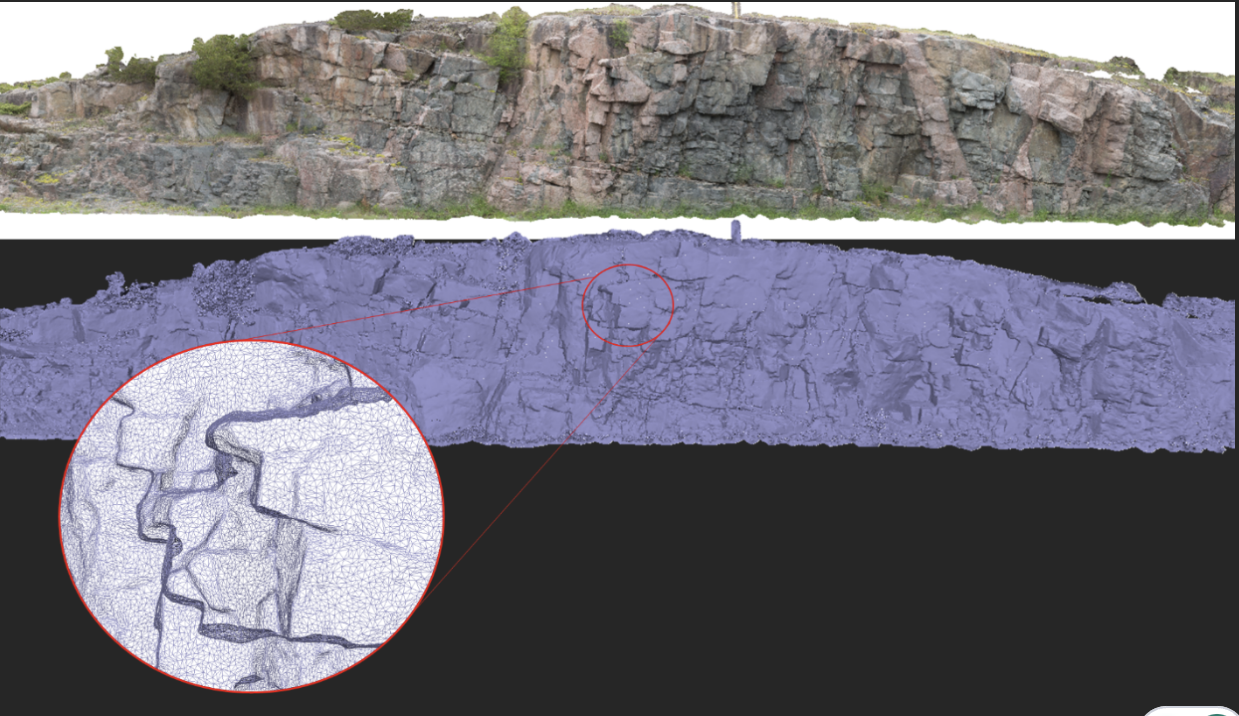
Creating Mappable Surfaces
Capture geological observations quickly, safely, and accurately, both in the field and office with HiveMap...

K-means clustering: compute inertia curve
In Geoscience ANALYST Pro the K-means clustering utility includes the ability to compute the data’s inertia curve...

A YouTube Channel about 3D modelling
We have quite a few how-to and tutorial videos lined up on YouTube highlighting our earth modelling, interpretation, and data management software for the construction of plausible geological models.