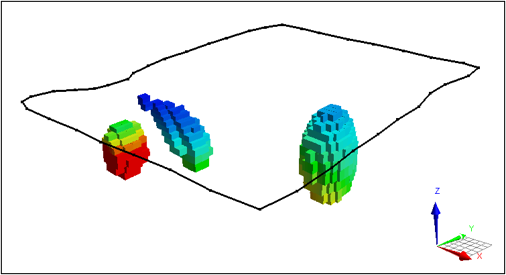
Visualize your block model in any direction with the new arbitrary section (available as of v3.1). This feature frees you from the restrictive u, v, and z axes, allowing you to view your data dynamically and in an orientation suitable to your data.

You can draw the section’s orientation, flip the strike, and manually edit the dip and strike.

Even better, you can set the arbitrary section to always face the camera, so that as you manipulate the view, the section will update to face you.

Previous tips can be found under the Software tip category in our News page and in our Archives page. Join our Virtual Lecture series that showcases technological advancements and provides quick tutorials on Geoscience ANALYST features. More details about this series on our Events page or sign-up to the mailing list.

Latest news

April, 01 2022

Visualize 3D vector properties

In GOCAD Mining Suite the normal of a surface is an example of a 3D vectorial property, where the components of the vector are...
Read more
How-to videos
May, 10 2024

Building a geological framework from exploratory modelling of magnetic data – Virtual Lecture

Join us on May 19, 2022 at 11am Pacific Time as Shaun O'Connor will demonstrate how to use the built-in scripting tools for exploratory geological modelling with sparse data...
Read more
July, 01 2021

Easily display a property on multiple objects

In GOCAD Mining Suite objects are grouped by the properties they contain...
Read more
March, 08 2021

Python API live link

In Geoscience ANALYST you can enable a monitoring directory to instantly visualize and analyze the results...
Read more
Company news
January, 03 2024

25 years modelling the earth together

Dedicated to driving technological innovation and excellence in the realm of geoscience. Your success is at the heart of everything we do.
Read more
Conferences
February, 02 2026

Attending PDAC 2026?

Visit us at booth 814 to see our software solutions in action and discuss your needs with our expert team!
Read more
February, 02 2022

New Visual Parameter – Contours

In Geoscience ANALYST you can visualize contours on 2D grids. Select your data, specify the contour parameters, or change the colour. ..
Read more
HiveMap
March, 11 2026

Remote Structural Mapping: A case study from the Golddigger property, BC

Capture geological observations quickly, safely, and accurately, both in the field and office with HiveMap...
Read more
April, 14 2022

3D drillhole design and monitoring in Geoscience ANALYST Pro v4.0 – Virtual Lecture

Jennifer shows the new and updated drillhole design and monitoring tools in Geoscience ANALYST 4.0...
Read more

Please contact our team for additional information about our products and services