



The newest version of Geoscience INTEGRATOR introduces powerful new functionality to streamline workflows and improve usability
Key new features:
-
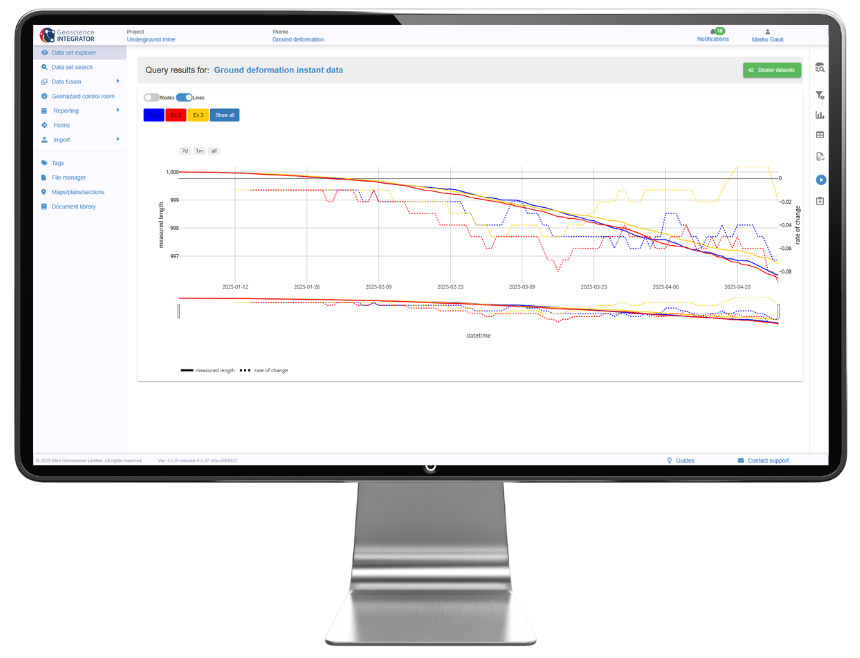
Display multiple stations and Y-axis values in time series charts, distinguished by colour and pattern.
-
Refresh the design of the Data set explorer, Import history, and Project settings pages.
-
Overwrite collar locations or replace drillhole paths directly from CSV files, with automatic updates via Monitoring folders, without the need to delete and re-import data.
Please note that Geoscience INTEGRATOR 4.2 is compatible with Geoscience ANALYST 4.6. Previous versions of Geoscience ANALYST will not be compatible with this release.
Is this your first time working with Geoscience INTEGRATOR?
Visit our YouTube channel, or check out the Resources tab on our website for tips and tutorials. You can also sign up for our email newsletter or join our community on LinkedIn to stay abreast of the latest news.
Please contact our team for additional information about our products and services
Latest news

New release – Geoscience ANALYST 4.6
Geoscience ANALYST 4.6 brings performance improvements and key new features to all modules. Download it now!
Revolutionizing Subsurface Interpretation and 3D Visualization with Geoscience ANALYST Pro
Discover how EnBW is bridging the gap between 2D mapping, 3D seismic interpretation, and integrated geophysical workflows

GEOH5: A Framework for Geoscience Data and Model Portability
Used by thousands, GEOH5 is the open-source data structure that is taking down the interoperability barriers and revolutionizing...

John McGaughey receives the Grahame Sands Award
John McGaughey, President of Mira Geoscience, receives ASEG's 2024 Grahame Sands Award for a career dedicated to innovation in applied geophysics.

Creating 3D geological starting model from geological maps and structural measurements
In this lecture, Philippe generates a 3D geological model from a map with structural measurements in Geoscience ANALYST...

Pointer Tracking
In GOCAD Mining Suite you can take advantage of the Pointer Tracking view to track coordinates, objects, and properties.

Object’s Info
In GOCAD Mining Suite you can see how many nodes or triangles your Surface object consists of by right-clicking on...

Macros
In GOCAD Mining Suite you can save lots of time with SKUA-GOCAD’s macros, a built-in scripting tool in which you can record or enter a sequence of commands to carry out or repeat at any time...

Footprints project public data repository available soon
Project-generated and previously public data, models, and documents from the NSERC-CMIC mineral exploration project, “Integrated Multi-Parameter Footprints of Ore Systems...

New release – Geoscience INTEGRATOR 3.9
This version includes new functionality to provide a better user experience, such as: user notifications, new display options, and more!

Project locks
In GOCAD Mining Suite, lock files manage the reading and writing of SKUA-GOCAD projects. They are automatically created...

Data fusion – Automatic sample compilation
In Geoscience INTEGRATOR, the Sample compilation page offers powerful tools to support the analysis of complex or difficult-to-view relationships within your sample data...