



Creating Mappable Surfaces
HiveMap relies on detailed, georeferenced 3D surfaces of rock exposure – preferably with an overlaid photograph – to facilitate digital mapping. Of course, what ‘detailed’ means is very much scale-dependent, and the best practices on data capture vary depending on the setting and application. For example, the scale at which an exploration geologist would undertake a regional lineament analysis varies considerably from a grade control geologist defining dig limits in an open pit setting!
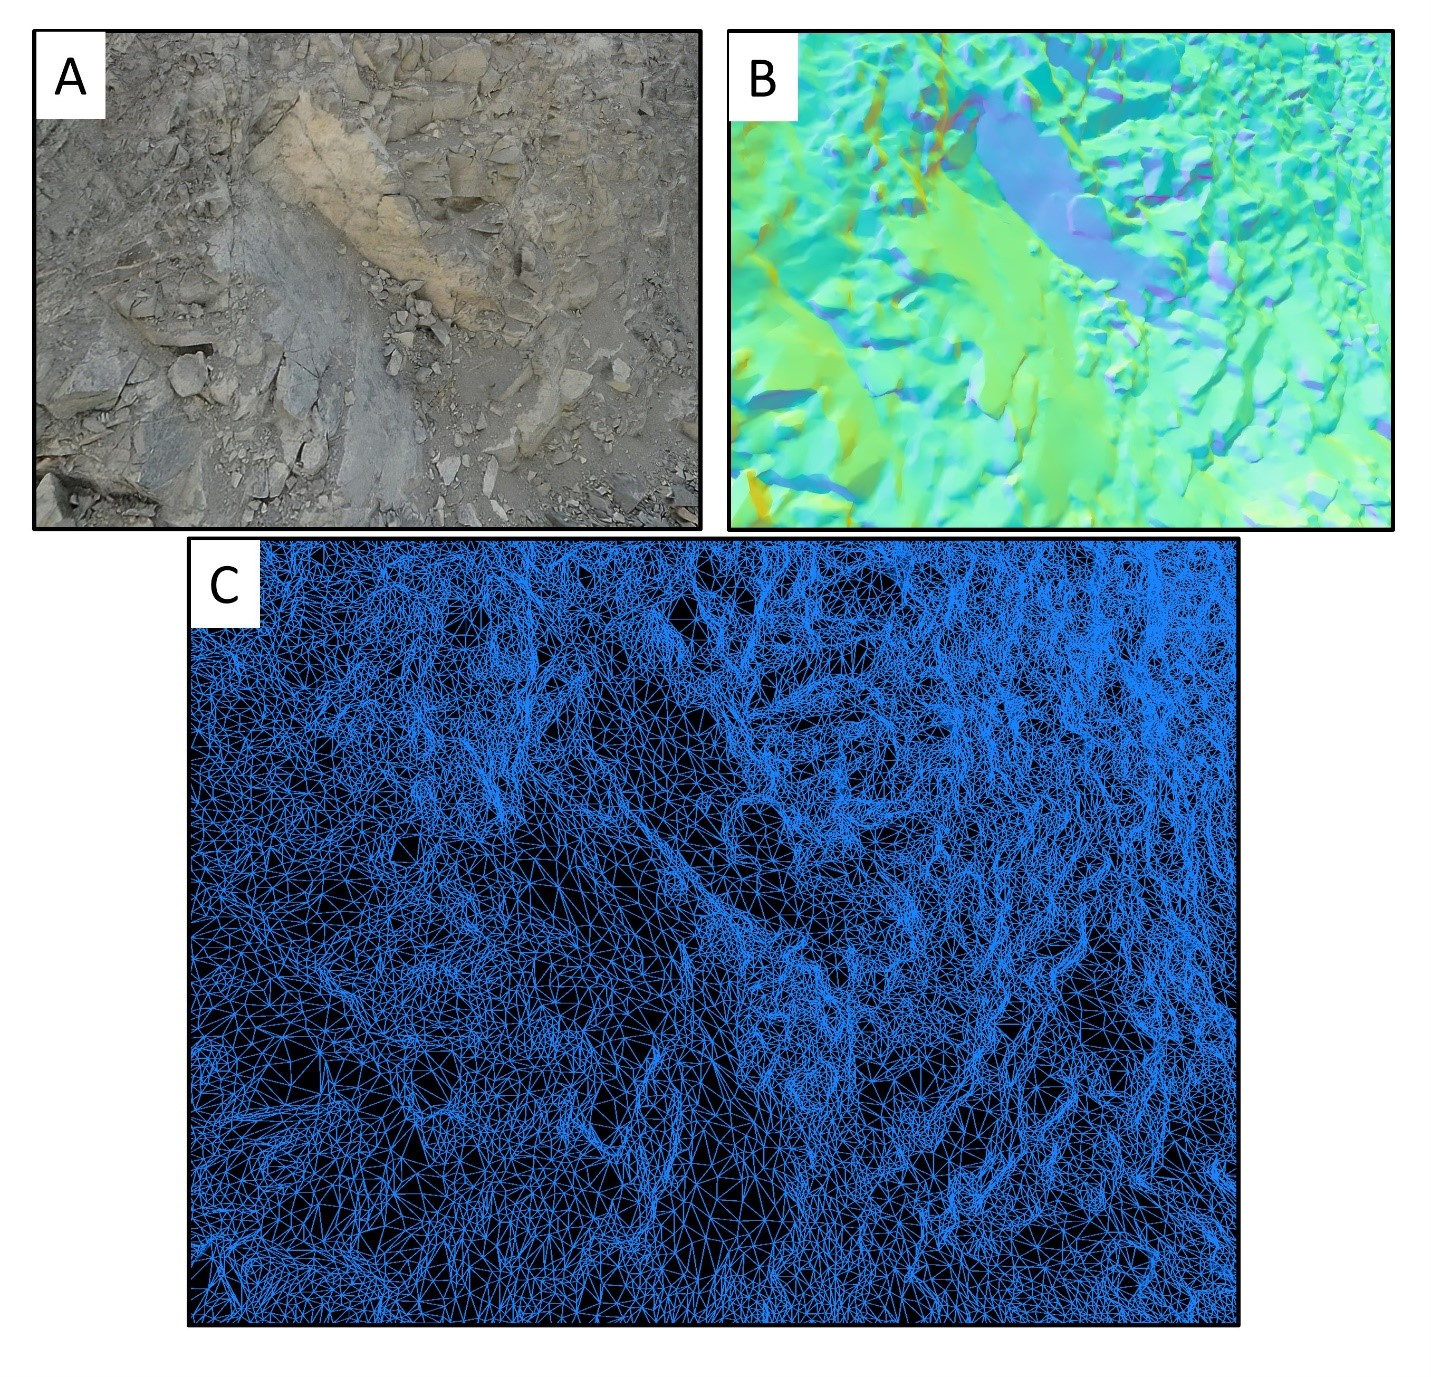
In order to fully explore this discussion, we need to lay the foundation, which is an understanding of what the surfaces we are mapping actually are. The surface is a collection of linked triangles, connected along shared edges, as shown in Figure 1; this surface is sometimes referred to as a mesh, or as a triangulation, but for the sake of consistency, we are going to refer to these as surfaces throughout this post. The two most common sources of mappable surfaces are LiDAR scanning and photogrammetry, with each source of data being processed differently. The image shows an example of a high-resolution mappable surface. You can see in A the surface with the draped image over it, B the same surface colored by dip which highlights the faces well, and in C the actual network of small triangles that make up the surface.
Figure 1: examples of a surface showing a draped image, the facets coloured by dip and the mesh the surface is made from.
Triangle Size
If we are digital mapping in HiveMap in support of detailed geotechnical work in an operational mining setting then we need the triangles, or facets, of our 3D surfaces to represent features as small as the centimeter scale. Conversely, if we are mapping landforms in support of mineral exploration, we will typically want the triangles of our mappable meshes to be in the range of one to five meters across.
This difference in triangle size controls both the smallest mappable features, but also directly controls the file size and usability of the surfaces. Triangle size is often referred to as resolution, so phrases like, ‘this is a high-resolution mesh’ actually mean that the triangles making up the mesh are sufficiently small.
For example, triangles in a surface we are mapping to support an engineering study may be as small as 0.5-2cm along each of their three edges. However, it is often not really possible to quantify the resolution using a single number that describes the exact length of every triangle edge in the surface. This is due to the way that the datasets are collected, the processing choices are made, and the natural variation of the rock exposure itself.
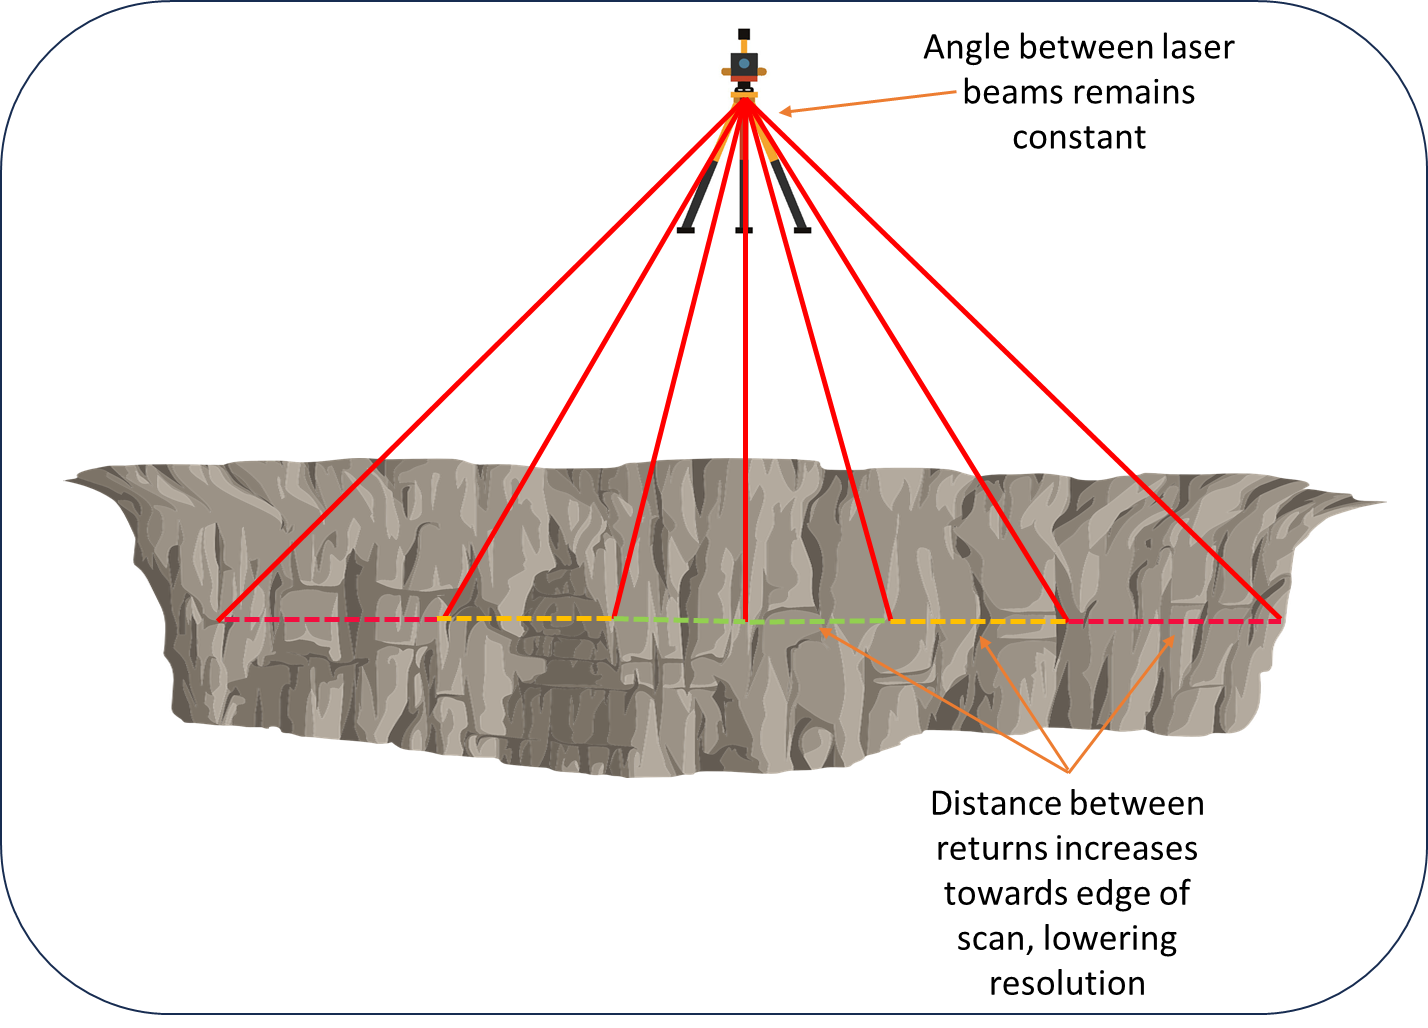
To illustrate this, terrestrial LIDAR tools project laser beams from the device with a fixed angle between them. If you are scanning a flat wall, to which the device is setup perpendicularly, then the distance between the impact points at the edges of the scan is more than the distance between impact points in the middle of the scan.
Also, fundamentally, the shape of the rock exposure is not regular, and therefore varying triangle sizes – and varying lengths on each side of the triangles – are required to represent the different rock faces, to prevent smoothing of the surface. In many cases, the area of interest contains portions not visible to the sensor, known as “occlusions”, where the sensor was unable to capture data.
In these areas the surface will appear lower resolution than the surrounding mesh and will have a smoothed appearance. This is due to a lack of data in the occluded zones, forcing the meshing algorithm to interpolate over a larger distance.
Figure 2: Distance between individual laser returns increases towards edge of scan, lowering resolution.
Surface Usability
We have discussed already that we want to have different surface resolutions to support different geological and geotechnical mapping purposes and established a general link between the extents of the surface coverage and appropriate surface resolution. More detailed analysis needs higher resolutions (smaller triangles), often captured over smaller extents, while larger areas will need to be captured at a lower resolution (larger triangles), to allow for a greater mappable area.
What we have not discussed yet is why this is necessary. Usability in HiveMap is largely controlled by the number of triangles in the surface. The more triangles in the surface the larger the file size, and the harder it is for HiveMap to render in 3D space. This detail is important: it is not the coverage of a mesh that controls usability, but the number of triangles the surface contains.
By extension, we can start to understand that the choices made during design of the data capture process and subsequent processing are effectively trying to balance coverage and triangle size to get the most detail possible while still creating a surface that can be worked with.
While it is not possible to add detail (make smaller triangles) during the processing stage, it is possible to reduce the triangle density, resulting in a smoother, less detailed, but potentially more usable mesh depending on our purpose. For this reason, it is often recommended to capture a higher resolution than likely required, and then establish an appropriate surface resolution during processing, which opens the door to different coverage and resolutions of meshes being generated from the same dataset for different purposes and mappers. An example of this case is during the mapping of large open pit exposures.
From the same dataset a Geotech may require a higher resolution mesh to define joint set populations, continuity or spacing, while a structural geologist is more interested in multi-bench scale features to incorporate into a structural model and will want to use a lower resolution mesh covering a larger area.
Tiling Surfaces
One simple approach that can be adopted during data processing to support mapping in HiveMap is to split large datasets into a set of smaller pieces – referred to as tiles. While a single high-resolution surface, covering a large spatial area, may not be practical to work with, tiling allows each smaller area to still be high resolution allowing the mapper to load and map them sequentially, without compromising between resolution and usability.
During this process it is often worth considering producing multiple different resolutions and scales of surface, as described above. Consider the situation where a mapper needs to produce a map of a large-scale open pit. It will be helpful to have the context to see the whole pit as one surface, but a surface of a high enough resolution to be mappable will not be practically usable at that scale. During processing it would be good to produce a lower resolution surface of the whole pit, and then produce a set of tiled high-resolution surfaces for the mapper to use for detailed interpretation and mapping.
Imagery
The highest quality digital mapping in HiveMap can be done when the surface is supplemented with available imagery. In the case of photogrammetry, an image or texture is generated during the surface building process. This texture is “applied” to the surface, which can be directly imported into HiveMap. LiDAR is slightly different, where the unit needs to have a camera, in addition to the sensor. In this case, an RGB color value is mapped onto each point of the point cloud. During the surfacing process, the RGB values are interpolated between points across the mesh. When a mesh and imagery file are used together, this is known as a “textured mesh”.
To increase the performance in HiveMap, it is possible to create a lower resolution surface, while maintaining a high-resolution texture file. In this case the mapper is able to observe the same level of detail, while not limiting the software’s performance.
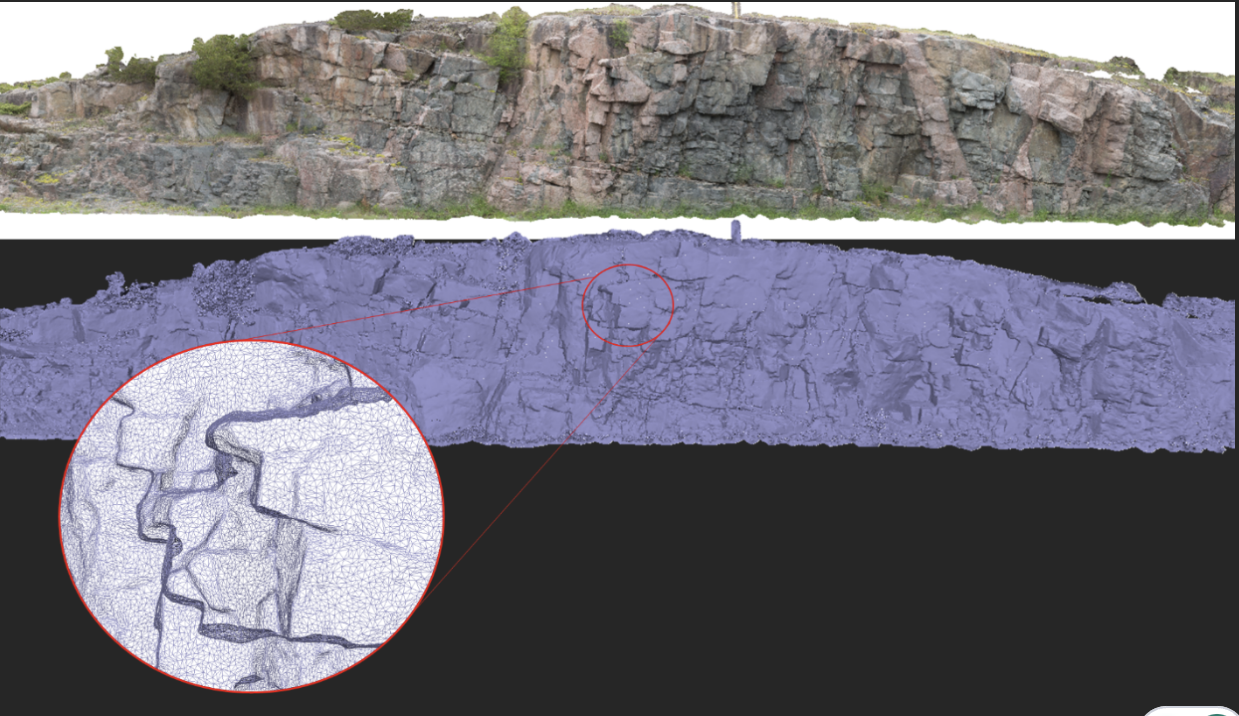
Figure 3: An example of a mappable surface, highlighting that the surface is made up of many small interconnected triangles.
Closing Insights: Mastering Mappable Meshes for Superior Digital Mapping Outcomes
We hope this overview of what a mappable mesh is has been useful. We find that having a strong understanding of basic principles makes it much easier to understand the practical considerations during data capture and processing that will result in surfaces that allow for rapid and high-quality mapping in HiveMap!
Please contact our team for additional information about our products and services
Latest news

GEOH5: A Framework for Geoscience Data and Model Portability

Mira Geoscience receives the 2023 AME Innovation Award

New release – Geoscience ANALYST 4.6

Machine learning in mineral exploration


3D seismic data

SimPEG open-source modelling and inversion with Geoscience ANALYST Pro Geophysics
Is the surface opened or closed?

Manual classifications vs Project classifications

Scripting

Filter records with, or without files associated to them
