


Exploiting the advantages of both supervised and unsupervised learning
The potential benefits of AI in mineral exploration are staggeringly large, yet its application is far from simple. In mineral deposit targeting, explorers are trying to identify the location of ore deposits at the core of a very complex system. Evidence of the deposit footprint must be assembled from interpretation of subtle alteration effects, for example, that may extend kilometers from the target. Meeting this challenge requires as much focus on how the problem is set up for generating AI predictive models as on the AI methods themselves. This is where deep domain knowledge and a mining industry-specific, supporting computational framework is required.
We have applied machine learning as part of custom solutions to complex exploration and geotechnical problems since 2015. Our advanced geological modelling and geophysical inversion tools give us the capability to create a fully integrated interpretation, capturing all the relevant features in a single earth model, as input to machine learning algorithms. This makes for sound feature engineering, a key success factor for the application of AI to mineralized system targeting.
Case study:
Radiometric alteration footprinting in IOCG environment, Mount Dore project area, AU
In sparse data or grassroot environments, it is useful to be able to quickly identify alteration footprints of IOCG mineralization. In the case of the Mount Dore region, we tested whether it would be possible to identify the alteration footprint of IOCG deposits using airborne magnetic and radiometric data as a starting point.
Using four features and a hierarchical clustering (unsupervised learning) approach, we tested the ability to generate proxies for the mass balance of potassium and uranium linked to alteration effects. The clustering method enabled the generation of groups of data points with similar magnetic, potassium, thorium, and uranium signatures, which exhibited remarkable correspondence to the geological map.
Once the groups were established, a 3D regression was used to estimate the expected potassium and uranium signatures for each group of points. Then, a residual value was calculated and used as a proxy for mass balance of both elements. For example, areas with excess potassium were established by comparing the expected potassium for the rock type (data group) to the measured values; they were then considered as being enriched in potassium by alteration processes. Both the potassium and uranium residuals were then combined to produce an alteration map for IOCG deposit footprints. Areas of both potassium and uranium enrichment were considered prospective.
This approach performed quite nicely at finding already known deposits in the Mount Dore area, as showcased on the figures below.

Figure 1: Upper row represents the radiometric and magnetic survey points. The middle row shows the resulting dendrogram from the hierarchical clustering together with the grouped point clouds in the K, Th and U space. Last row left image shows the resulting clustered data compared to the geological map on the right. ©2010 Department of Natural Resources and Mines, Queenland. All rights reserved

Figure 2: Upper row shows the estimated residual values for both K and U in the data space. The last row shows the alteration heat map on the left and alteration footprint map with known deposits on the right. ©2010 Department of Natural Resources and Mines, Queenland. All rights reserved
Meet the authors:

John McGaughey, PhD – Founder and President at Mira Geoscience
John has extensive mining industry experience focusing on quantitative, multi-disciplinary 3D and 4D interpretation for mineral exploration and geotechnical decision support. He currently leads our technology strategy and our geotechnical business. Prior to founding Mira Geoscience in 1999, he spent 10 years at the Noranda Technology Centre as a Senior Scientist in their rock mechanics group. He obtained an MSc in geological engineering and a PhD in geophysics from Queen’s University. John is based in Montreal.

Jean-Philippe Paiement, P.Geo – Former Director of Global Consulting*
Jean-Philippe brought 10 years of mineral exploration experience including expertise in geostatistics, structural, geological, and geochemical modelling and interpretation. He is skilled in the application of machine learning to overcome geological challenges and with new methods to reduce interpretational risks with geological data. He has a wide range of experience in mineral resource estimation for precious metals, base metals and industrial minerals across diverse geological environments around the world. He obtained an MSc from Laval University. Jean-Philippe is based in Quebec-City. (*) Jean-Philippe left Mira Geoscience in 2023.
Latest news

Using predictive modelling in mineral exploration
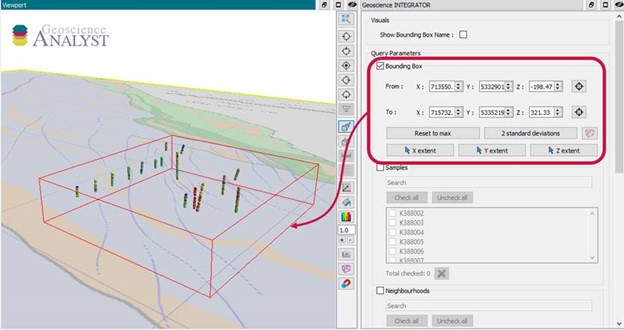
Automatic calculation of XYZ for drillhole sample location

Organizing files as data sets
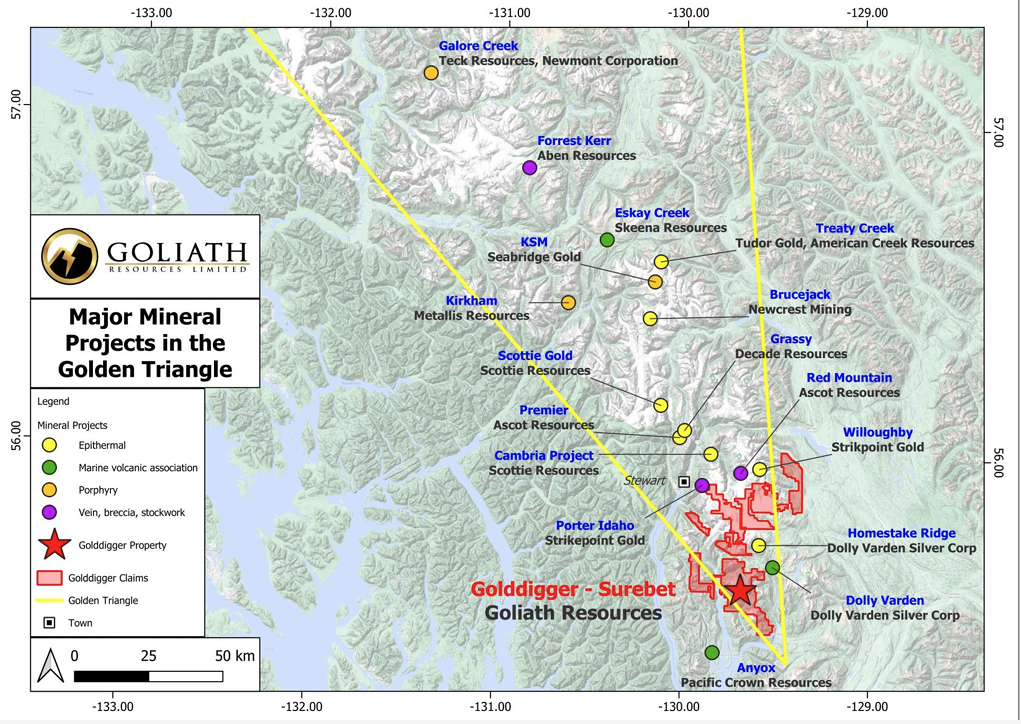
Remote Structural Mapping: A case study from the Golddigger property, BC

Women Geoscientists in Canada

Editing file settings

Plotting drillhole data

Finding data sets by tags and neighbourhoods

HiveMap Digital Mapping Software

Earth model’s themes are renamed
