



Geoscience ANALYST 4.0 allows you to compute drillholes’ deviation statistics. These include the mean, minimum, maximum, median, and standard deviation of the selected drillholes’ lift, swing, initial dip, and initial azimuth.
The selected drillholes can be filtered according to:
- 2D or 3D radius around a location: drillhole collars within the specified radius are selected.
- Initial orientation: drillholes whose initial orientation is within the specified value and tolerance are selected.
- Depth: statistics are computed below the specified depth for the selected drillholes.

The results can be copied to the clipboard for future reference and documentation. This information can be used when planning new drillholes with the Drillhole Designer in Geoscience ANALYST Pro.
Watch this recording for a demo, tips, and tricks.
Previous Geoscience ANALYST tips can be found under the Software tip category in our Resources page and in our Archives page.
Latest news

Themes
Geoscience INTEGRATOR v3.5 and Geoscience ANALYST v3.2 include new themes and renamed ones to help you to locate data in a more intuitive way.

New release – GOCAD® Mining Suite 22 update1
GMS 22u1 comes with improved connectivity to Geoscience ANALYST and better interoperability with GEOH5.

Extracting property names from a CSV
In Geoscience INTEGRATOR, extract the property names directly from a CSV file to speed up the process and reduce errors...

Geoscience ANALYST Pro Geophysics Consortium
Focused on delivering software and methods that make the use of advanced geophysics a day-to-day, practical reality for industry.

View neighbourhoods in 3D
You can display your neighbourhoods in Geoscience INTEGRATOR 3D viewer, making it easier to understand spatial distribution of the data.

New release – Geoscience ANALYST 4.7
Geoscience ANALYST 4.7 delivers a significant set of new tools and performance enhancements. Download it now!

Improved scatter plots
In Geoscience INTEGRATOR, you can can increase/decrease the node size, take snapshots, zoom in on an area of interest...

Q&A with VR Resources
Join us in this exciting conversation with Michael Gunning on how to find success in blue-sky exploration through integrated interpretation of magnetic data and structural geology

Let the data speak!
Four years ago, along with DMT Group, we started working with JSC Apatit on their Kirovski and Rasvumchorr mines that...
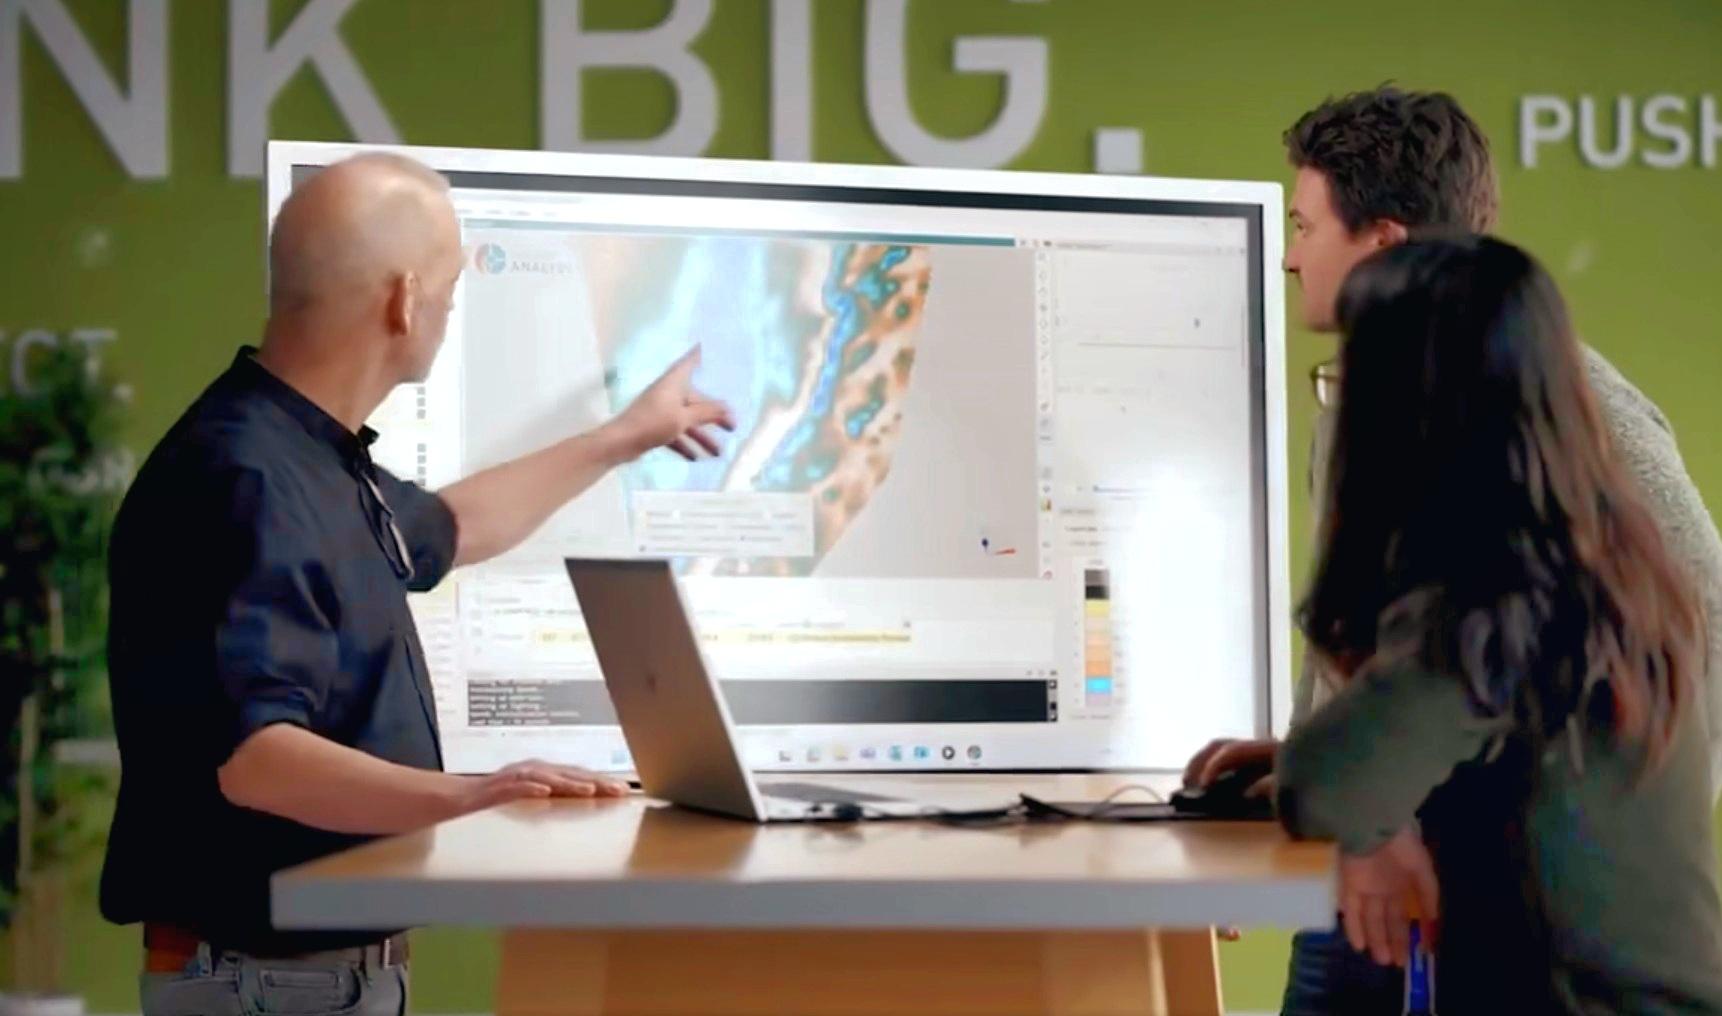
Revolutionizing Subsurface Interpretation and 3D Visualization with Geoscience ANALYST Pro
Discover how EnBW is bridging the gap between 2D mapping, 3D seismic interpretation, and integrated geophysical workflows

UBC-GIF or VP Suite inversion?
"The programs are complementary, and the combination gives one the ultimate flexibility in potential-field inversion,” says Kristofer Davis, Scientific Programmer at Mira Geoscience.

Importing objects from project
In GOCAD Mining Suite you can easily import objects from one GOCAD project to another by...