



In version 19, you can save the view as a Scene by right-clicking on the 3D Viewer > (Scene) Save As…

Scenes save the scale, point of view, and style of the 3D Viewer, the objects’ visibility status, and the style of objects. To edit these options when applying a scene, select Apply > More Apply Options.
Scenes can also be copy-pasted from one 3D Viewer to another.
Previous tips can be found under the Software tip category in the News section and in the Archives section of our website.
Latest news

The value of using structural restoration tools in exploration modelling – Virtual Lecture
Watch recording - Jean-Philippe shows the use of structural restoration tools in GMS as a modelling tool for structurally controlled deposits...

EM101: Tips and tricks for EM data in Geoscience ANALYST
In 20 minutes, James Reid show's you EM101 using Geoscience ANALYST Pro, a low-cost...

Linking viewports
In Geoscience ANALYST you can synchronize the perspective of all visible Viewports to zoom, pan, and rotate them all at once...

New release – GOCAD® Mining Suite V14.5
GMS V14.5 expands the Python API, enhances connectivity with Geoscience ANALYST, and improves interoperability through the open GEOH5 format.

Coordinate display area
In Geoscience ANALYST you can get real-time feedback on the XYZ coordinates corresponding to the...
..

Using magnetic susceptibility measurements to define mineral exploration targets
Combining magnetic survey data with measured drillcore susceptibility data greatly increases the resolution and geometrical accuracy of the magnetic inversion...

Copying objects between Workspaces
In Geoscience ANALYST objects can be copied from one Workspace to another by using Ctrl+C and Ctrl+V...

3D seismic data and survey designer tools
Coming soon to Geoscience ANALYST, tools for hard rock seismic...

New release – Geoscience ANALYST 4.6
Geoscience ANALYST 4.6 brings performance improvements and key new features to all modules. Download it now!
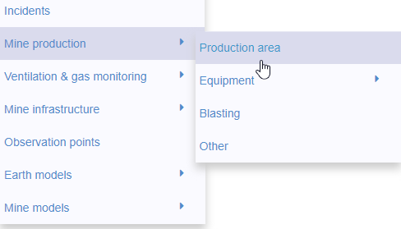
New mine production theme
In Geoscience INTEGRATOR, version 3.2 has a new theme called Production area. It’s designed for stope, mining room, or drawpoint data...

Improved data analysis
Analyze your data with enhanced histogram display options available in GOCAD Mining Suite v19...

Generating exploration models from a detailed structural interpretation and Artificial Intelligence
This approach uses the comment field of the logging table to extract general topics that can then be used as learning features in a supervised machine learning classification approach.