



Version 3.8. allows you to build and display custom colour scales when making a scatter plot or showing level plans in the Model compilation. They are a great way to identify different ranges in the data or have a display with a particular standard.

These custom colour scales can have as many intervals as necessary. To create a new colour scale click on the  icon next to the colour spectrum.
Previous tips can be found under the Software tip category in the Resources section and in the Archives section of our website.
Latest news

ODBC drillhole import
In Geoscience ANALYST you can import drillholes straight from your ODBC database...

Using Python with Geoscience ANALYST
A new Geoscience ANALYST Python API, providing the capability of connecting to open source software, is scheduled for release....

Customize the Viewport axis labels
In Geoscience ANALYST you can customize the Viewport axis labels
..

Organizing files as data sets
In Geoscience INTEGRATOR, a data set is often composed of a group of files of various formats along with metadata. These can be grouped...
Automatic calculation of XYZ for drillhole sample location
In Geoscience INTEGRATOR, drillhole sample locations are automatically computed as XYZ by the system from the deviation surveys...

Crustal scale gravity modelling and isostatic correction over central Chile
View recording - Thomas demonstrates how to apply an isostatic correction to gravity data through a case study over central Chile using...

Peak finder – Geoscience ANALYST geoapps: Python application
Past event. Link to recording available here.

Reopening selected commands
In GOCAD Mining Suite the Log and Command Messages panel has a new tool to reopen previously executed commands...

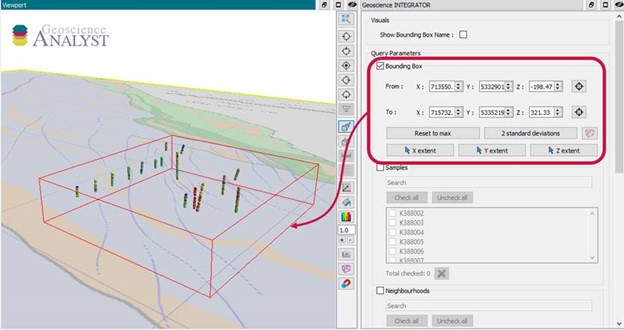
Search for data by spatial extent
This video shows you how to search for data from Geoscience INTEGRATOR by spatial extent...

Including water bodies in gravity and magnetic inversion modelling – Geoscience ANALYST Pro Geophysics
Thomas Campagne demonstrated how to explicitly include bathymetry in inversion modelling of near-shore gravity data...
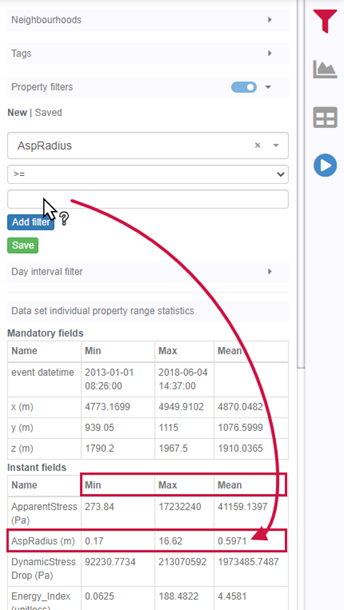
Property value range
In Geoscience INTEGRATOR, You can refer to the range of values in the query panel to apply numeric property filters...

Using ioGAS in Geoscience ANALYST Pro – Virtual Lecture
Past event, recording available here...