
A new Geoscience ANALYST Python API, providing the capability of connecting to open-source software, is scheduled for release. It provides the ability to connect open-source geophysical, machine learning, or other computational codes to a powerful 3D visualization environment designed specifically for the geosciences and mining. This sneak peek video demonstrates an example of using open-source machine vision algorithms to extract lineaments from magnetic data for 3D interpretation.

Two open-source algorithms are used to extract edges as binary images and convert them into parametric lines: The Canny edge detector and the Hough line transform.


Interested in trying it out? Have a look at this video, or

… more”How to” videos for Geoscience ANALSYT can be found on our YouTube Channel and Tips on how to use Geoscience ANALYST can be found under the Software tip category in our News page and in our Archives page.

Latest news

August, 08 2022

ODBC drillhole import

In Geoscience ANALYST you can import drillholes straight from your ODBC database...
Read more
March, 02 2022

Filtering time-based data

In Geoscience INTEGRATOR, there are various ways to filter time-based data, by shirts, property, or even day intervals...
Read more
HiveMap
March, 11 2026

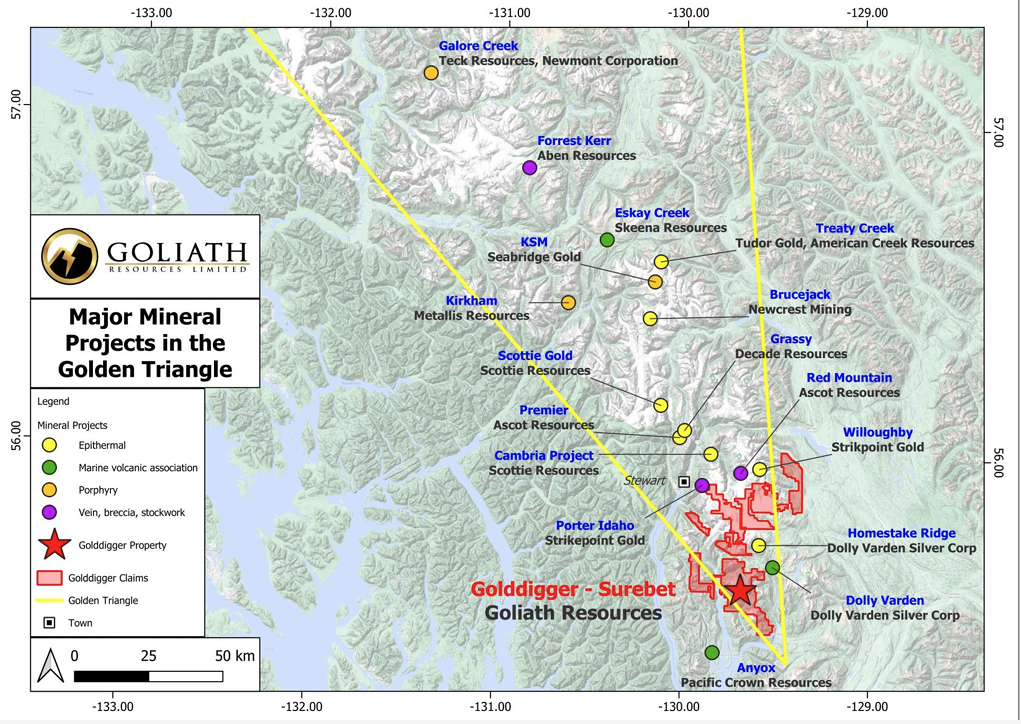
Remote Structural Mapping: A case study from the Golddigger property, BC

Capture geological observations quickly, safely, and accurately, both in the field and office with HiveMap...
Read more
Case studies
March, 29 2015

Using predictive modelling in mineral exploration

We carried out targeting work for IOCG-style mineralisation in the Mt Dore area of QLD, Australia. We produced a 3D model and predictive exploration map...
Read more
February, 09 2022

Roles and permissions

In Geoscience INTEGRATOR, system administrators give users different levels of permission by role-based access...
Read more
January, 25 2021

Display multiple Voxet sections

In GOCAD Mining Suite, you can create additional sections, hide/show them, use the slider and arrow to position them along the Voxet, and delete them...
Read more
January, 03 2019

Customizing metadata

Version 3.0 of Geoscience INTEGRATOR has a new layout for data set summaries that allows you to document any general information as custom...
Read more
February, 03 2019

Organizing files as data sets

In Geoscience INTEGRATOR, a data set is often composed of a group of files of various formats along with metadata. These can be grouped...
Read more
February, 02 2022

New Visual Parameter – Contours

In Geoscience ANALYST you can visualize contours on 2D grids. Select your data, specify the contour parameters, or change the colour. ..
Read more

Please contact our team for additional information about our products and services