


Table and chart items from ad-hoc or scheduled reports can be easily refreshed, using the same filters that were applied in the original report, to display current data.
Items count > Chart, Table, or Chart and Table Name > Apply changes.

You can also modify the filters and run the query again without modifying the items captured in the reports.
Previous tips can be found under the Software tip category in the News section and in the Archives section of our website.
Latest news
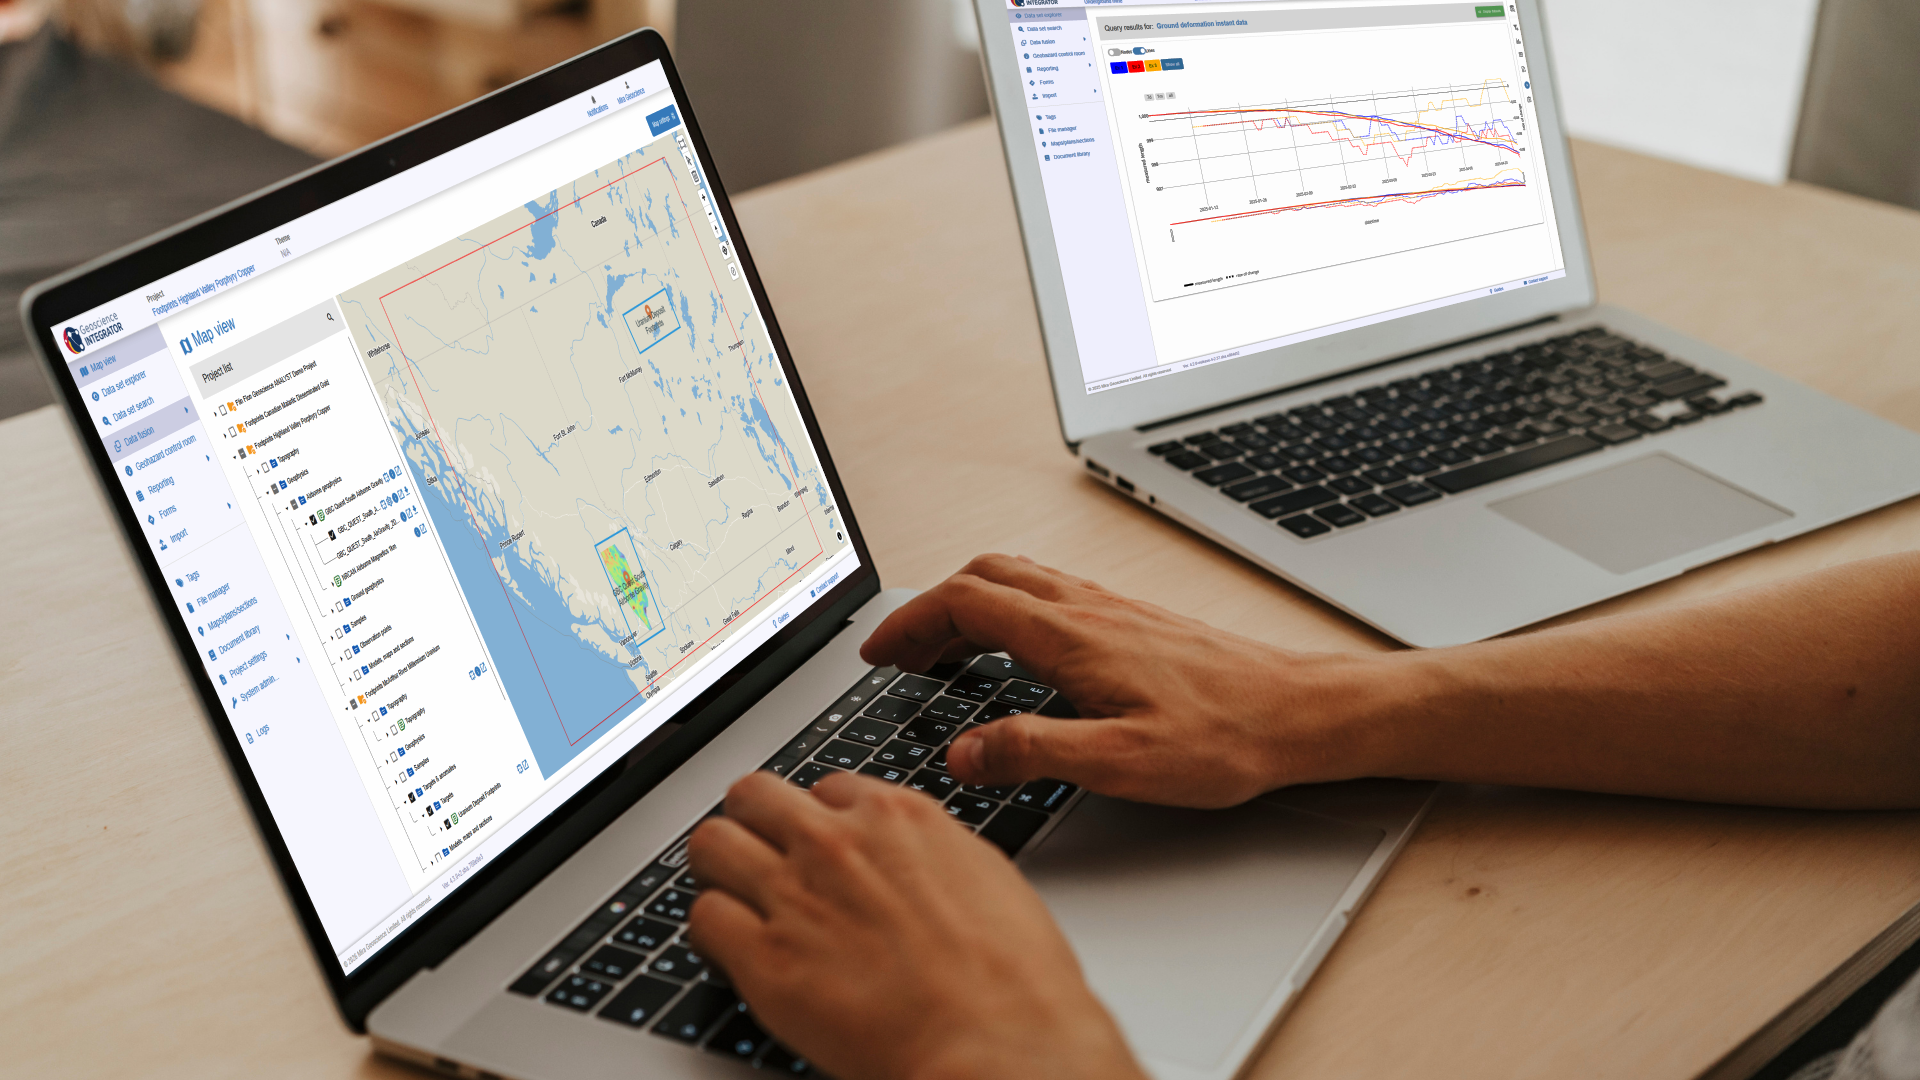
New release – Geoscience INTEGRATOR 4.3
Geoscience INTEGRATOR 4.3 introduces exciting new features to help you manage your data more efficiently and streamline your workflow

Machine learning in mineral exploration
We have applied machine learning as part of custom solutions to complex exploration and geotechnical problems since 2015...

Tagging query results
In Geoscience INTEGRATOR, this allows you to rapidly access that subset of objects. Instead of having to search and select multiple filters every time...

Q&A with Oleg Brovko, Senior Project Geophysicist at Geofocus
Join us in this exciting conversation with Oleg Brovko on harnessing Geoscience ANALYST and open-source technology for advanced geophysical solutions

K-means clustering
In Geoscience ANALYST Pro’s v3.3, you can quickly partition your data based on the K-means clustering...

Object’s history
In GOCAD Mining Suite, objects keep a history of all the commands you apply to them, this includes...

UDMN Award of Excellence
Geoscience INTEGRATOR wins - Last December, UDMN presented us with an Outstanding Achievement in Commercialization...

Coordinate display area
In Geoscience ANALYST you can get real-time feedback on the XYZ coordinates corresponding to the...
..
Using Python in Geoscience ANALYST Pro – Virtual Lecture
Past event, link available here...

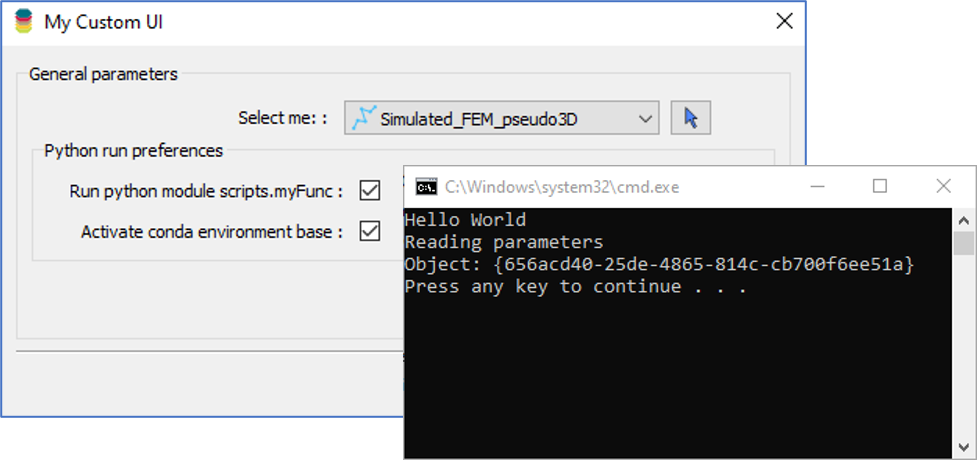
Scripting
In Geoscience ANALYST Pro the Script on Object Property utility in Geoscience ANALYST Pro can be used in a wide variety of geoscientific applications...

Python applications for geoscientific problems
geoh5py and geoapps - Open format, open source code, and open licensed data! Cannot get any better than that!

Dynamically turn on/off classes in scatter plots
In Geoscience INTEGRATOR, you can turn on/off classes in scatter plots...