


In Geoscience ANALYST Pro’s version 3.3, you can quickly partition your data based on the K-means clustering algorithm. This simple, yet powerful algorithm allows you to take a data science approach to group data into a specified number of clusters.
In this example, geochemistry surface samples are split into 6 clusters according to their K2O%, SiO2%, TiO2%, and Zr_ppm values.

Previous tips can be found under the Software tip category in our News page and in our Archives page. Join our Virtual Lecture series that showcases technological advancements and provides quick tutorials on Geoscience ANALYST features. More details about this series on our Events page or sign-up to the mailing list.
Latest news

A YouTube Channel about 3D modelling
We have quite a few how-to and tutorial videos lined up on YouTube highlighting our earth modelling, interpretation, and data management software for the construction of plausible geological models.
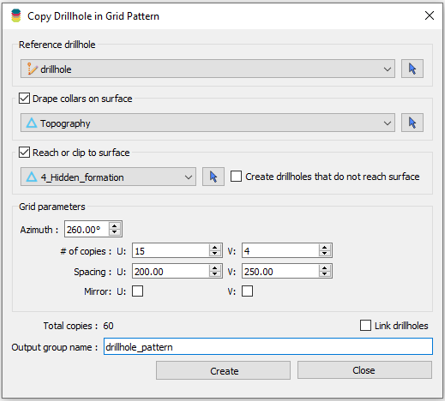
Copying drillholes in a grid pattern
In Geoscience ANALYST you can copy an existing drillhole’s collar and deviation in a grid pattern to map a mineralized horizon...

New release – GOCAD® Mining Suite V14.5
GMS V14.5 expands the Python API, enhances connectivity with Geoscience ANALYST, and improves interoperability through the open GEOH5 format.

Visualize 3D vector properties
In GOCAD Mining Suite the normal of a surface is an example of a 3D vectorial property, where the components of the vector are...

Default data colour settings
In Geoscience ANALYST you can set a default colour table and colour mapping transformation function. This way, when you import or create new data, it will be coloured by default.

Attending AME Roundup 2026?
Visit us at booth 416 to see our software solutions in action and discuss your needs with our expert team!

Drape Voxet properties on surfaces
In GOCAD Mining Suite you can texturally drape your images and 2D gridded data onto surfaces, for example...

25 years modelling the earth together
Dedicated to driving technological innovation and excellence in the realm of geoscience. Your success is at the heart of everything we do.

Advanced drillhole planning and monitoring
We partnered with Groupe MISA to develop a low-cost 3D application where all elements of drillhole design and monitoring...