By synchronizing the perspective of all visible Viewports, you can zoom, pan, and rotate them all at once.

This is especially useful when visualizing and comparing different types of data in several Viewports to ensure they are in the same scale and orientation.

Note: This option only appears in the Viewport toolbar when more than one Map or 3D Viewport is open. Also try tracking the location of your cursor in all Viewports by activating Link Cursors .

Previous tips can be found under the Software tip category in our News page and in our Archives page. Join our Virtual Lecture series that showcases technological advancements and provides quick tutorials on Geoscience ANALYST features. More details about this series on our Events page or sign-up to the mailing list.

Latest news

Conferences
December, 24 2025

Attending AME Roundup 2026?

Visit us at booth 416 to see our software solutions in action and discuss your needs with our expert team!
Read more
Geoscience ANALYST
March, 11 2021

Peak finder – Geoscience ANALYST geoapps: Python application

Past event. Link to recording available here.
Read more
HiveMap
September, 03 2026

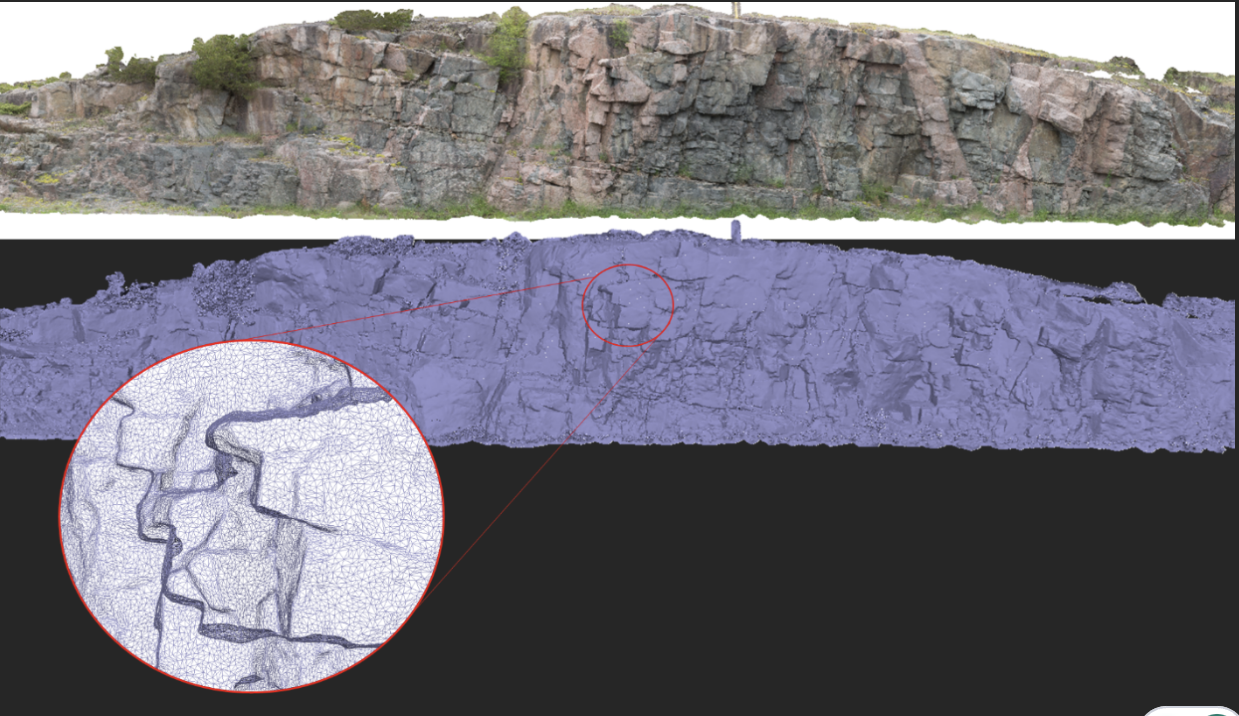
Creating Digital Models of Rock Exposure for Geological and Geotechnical Mapping 

Capture geological observations quickly, safely, and accurately, both in the field and office with HiveMap...
Read more
Geoscience ANALYST
April, 07 2026

Parametric Ellipsoid Modelling in Geoscience ANALYST Pro Geophysics

A Fast New Way to Interpret TEM Anomalies. Read more >>
Read more
Advanced geophysical interpretation, modelling and inversion
November, 03 2021

Deep Learning as an alternative to downward continuation filters for structural interpretation

Jean-Philippe Paiement proposes an alternative approach to the commonly used downward continuation filters used in the industry...
Read more
Developer’s sandbox
September, 23 2020

Python applications for geoscientific problems

geoh5py and geoapps - Open format, open source code, and open licensed data! Cannot get any better than that!
Read more
August, 01 2021

Data display precision

In Geoscience ANALYST Data Colours panel you can control the precision of the data...
Read more
Company news
January, 04 2024

Meet Polyanna Rowe, PhD

This release includes enhancements to several existing importers and exporters for extended interoperability, and more...
Read more
April, 01 2022

K-means clustering: compute inertia curve

In Geoscience ANALYST Pro the K-means clustering utility includes the ability to compute the data’s inertia curve...
Read more

Please contact our team for additional information about our products and services