



In the Data Colours panel you can control the precision of the data. You can choose how many decimal digits you want to display and change it to scientific notation.
These changes are reflected in the statistics of the Data Colours panel and in the Data Table columns.

Note that when exporting this table as a csv through Geoscience ANALYST Pro, the exported data will retain the displayed precision.
Geoscience ANALYST Pro offers low-cost tools for interpretation, targeting, and geophysical inversion. Activate your 10-day Free Trial now through the user interface.
Previous tips can be found under the Software tip category in our News page and in our Archives page.
Latest news

How to run gravity inversions in a geologically driven way
Past event, view here or on our YouTube Channel to see how to run a 3D inversion and forward modelling in Geoscience ANALYST Pro using VPmg...

Free mineral exploration data through Geoscience ANALYST
Past event - view here or on our YouTube channel...

Dynamically turn on/off classes in scatter plots
In Geoscience INTEGRATOR, you can turn on/off classes in scatter plots...

Documents linked to a project
When documents are linked to a project in Geoscience INTEGRATOR, it is possible to be more specific and link them to the project’s data sets...
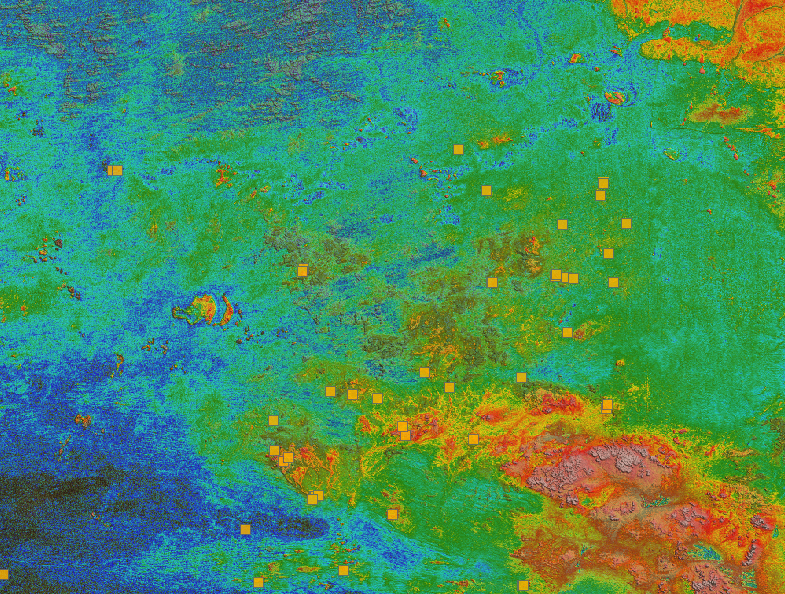
Building a greenfields project from public data in Geoscience ANALYST Pro – Virtual Lecture
See recording - Gem shows how Geoscience ANALYTS is a great tool to do exploration without getting your boots dirty...

New filter options on the File manager and the Maps/plans/sections
In Geoscience INTEGRATOR, you can now find files quickly by using the new extension, tags and uploaded by filters...

Coordinate display area
In Geoscience ANALYST you can get real-time feedback on the XYZ coordinates corresponding to the...
..

Behind the Scenes: A Technical Deep Dive – Chasing Innovation From the Ground Up
Explore behind the scenes our case study with Canadian Royalties on this technical deep dive, featuring Stanislawa Hickley.

K-means clustering
In Geoscience ANALYST Pro’s v3.3, you can quickly partition your data based on the K-means clustering...