


Since version 3.5, you can increase/decrease the node size, take snapshots, zoom in on an area of interest, and display spike lines. Various colour scales were added to better suit your data.
Performance-wise, scatter plots now support an unlimited number of points and tooltips now support up to 300,000 labels.

Previous tips can be found under the Software tip category in the News section and in the Archives section of our website.
Latest news

Manual classifications vs Project classifications
In Geoscience INTEGRATOR, There are two ways to create classifications when importing data...

Depth-to-basement inversion using geometry and homogeneous VPmg inversion
Past event - View here or on our YouTube channel...

Behind the Scenes: A Technical Deep Dive – Chasing Innovation From the Ground Up
Explore behind the scenes our case study with Canadian Royalties on this technical deep dive, featuring Stanislawa Hickley.
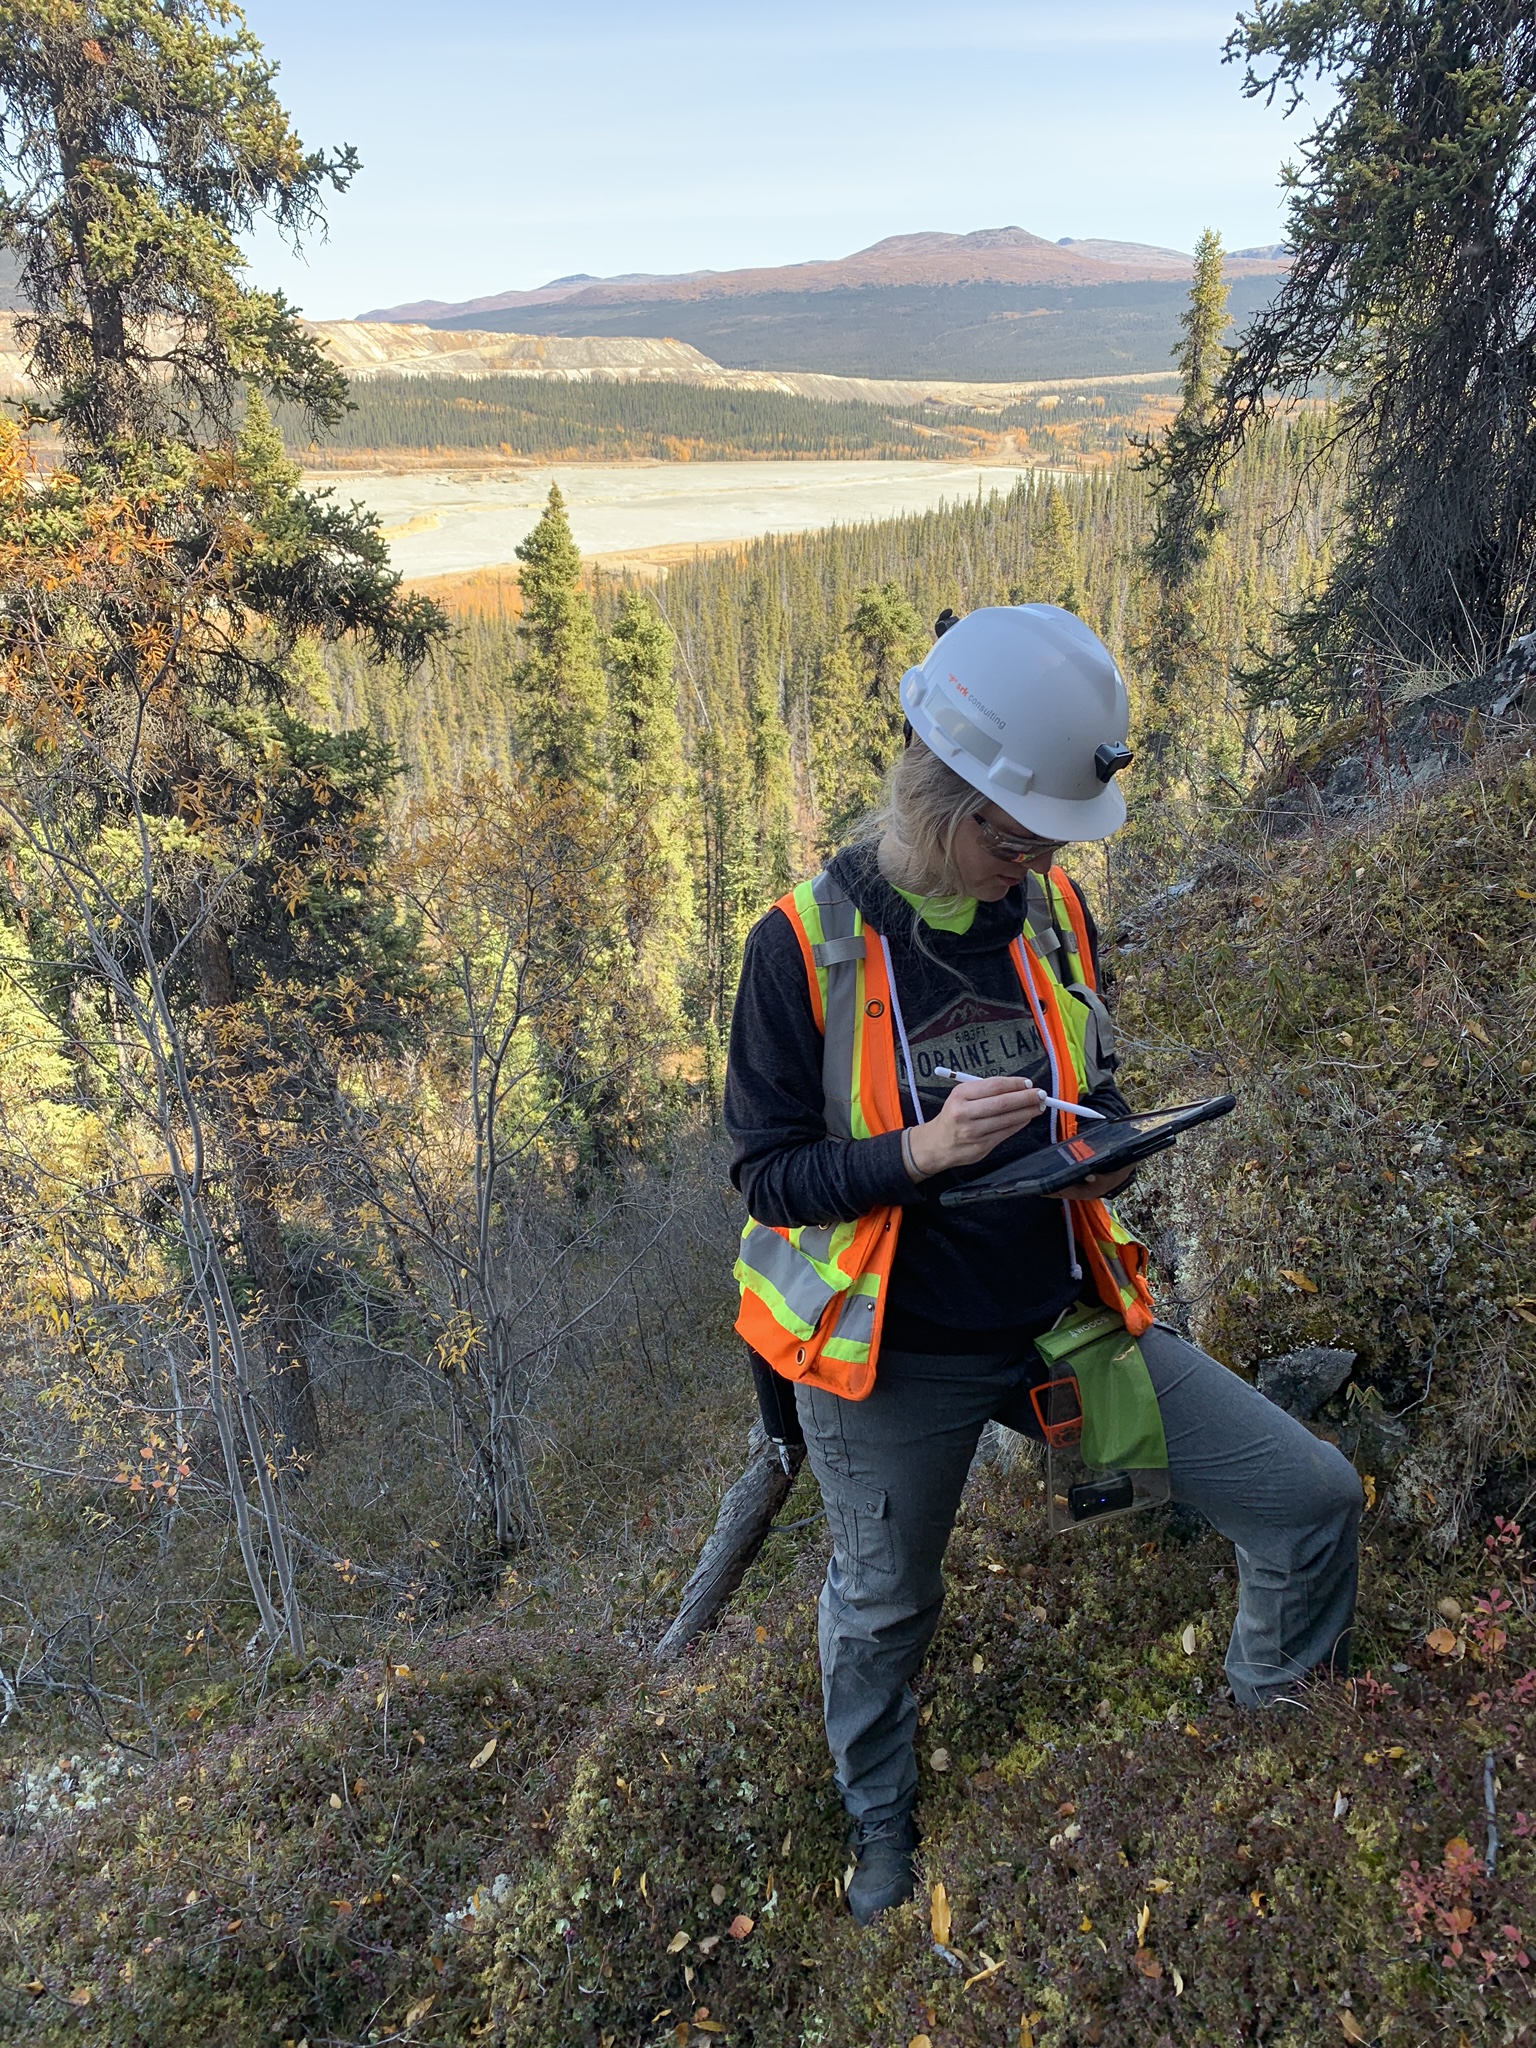
Why Is Mapping Important?
Capture geological observations quickly, safely, and accurately, both in the field and office with HiveMap...

Coordinate system transformations
In Geoscience ANALYST Pro version 4.0, you can apply coordinate system transformations to...

What’s new in Geoscience ANALYST version 4.0 – Virtual Lecture
Watch as Carla shows the new and updated tools in Geoscience ANALYST 4.0...

Mira Geoscience receives the 2023 AME Innovation Award
John McGaughey, Mira Geoscience's President, has been selected for the 2023 AME Innovation Award for leading the development of GEOH5.

Plotting drillhole data
While pencil crayons are still a vital part of geology, Geoscience ANALYST lets you get all your data into 3D in a convenient shareable format...
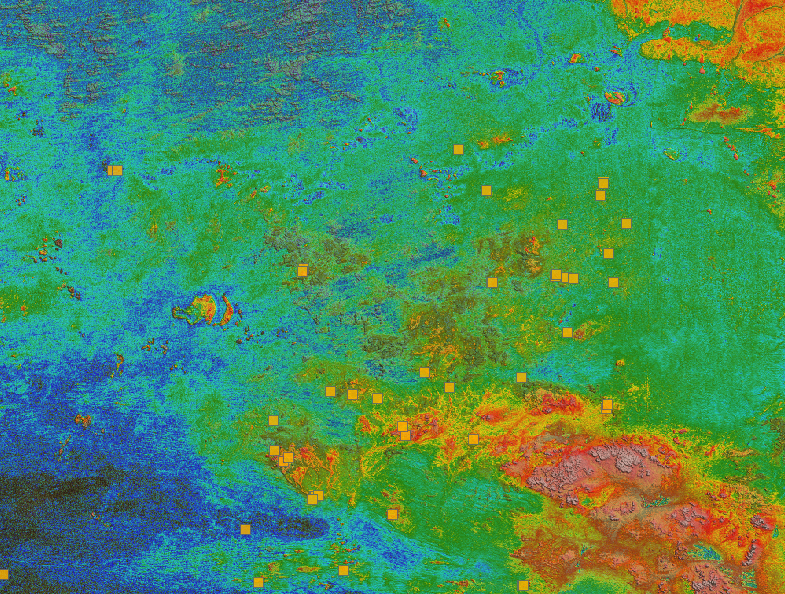
Building a greenfields project from public data in Geoscience ANALYST Pro – Virtual Lecture
See recording - Gem shows how Geoscience ANALYTS is a great tool to do exploration without getting your boots dirty...

Tabular property viewer
In GOCAD Mining Suite you can view your object’s properties in a tabular format with the Tabular Property Viewer...

New raster imports
In Geoscience ANALYST you can now import GeoTIFF (tif, tiff), ERMapper (ers), and Surfer (grd)...
..

Macros
In GOCAD Mining Suite you can save lots of time with SKUA-GOCAD’s macros, a built-in scripting tool in which you can record or enter a sequence of commands to carry out or repeat at any time...