Using HyperCube – An AI approach to mineral exploration data integration for targeting
Traditional approaches to data integration for targeting typically focused on statistical classification models, employing numerous assumptions that are generally not met in practice. Recent, successful advances in stochastic, non-Euclidean approaches to the problem of understanding complex data relationships have been made in disciplines such as genomics and epidemiology. Predictive models are constructed from the integration of complex data sets without the limiting assumptions of traditional statistical approaches. These new approaches can easily handle continuous, discrete, noisy, and missing data without the imposition of statistical models or assumptions. In partnership with HyperCube Research, we are applying such an approach to the exploration targeting problem. The method provides a series of robust rules describing the relationship between input exploration data variables and mineral occurrences. The rules discovered are typically of much greater utility than statistical trend observations. These methods have the potential to improve discovery rates when applied as part of a carefully planned and systematic process of modelling, interpretation, and target generation.
Case study:
Using predictive modelling in mineral exploration – Mount Dore area, AU
This approach can be applied wherever conventional Weights-of-Evidence, logistic regression, neural networks, or other data-driven approaches would be appropriate. Hypercube analyzes relationships amongst many variables simultaneously in multi-dimensional data space rather than criteria by criteria. It removes the difficulties of determining “cut-offs” or thresholds for individual exploration criteria by replacing them with more interpretively useful multi-parameter “rules” driven by geological reasoning.
A few years ago, we carried out targeting work for IOCG-style mineralisation in the Mt Dore area of QLD, Australia. We produced a 3D model and predictive exploration map using the WofE approach for this regional scale project. Using the same data sets, we tested the power of predictive analytics. The results were much more useful. In the Hypercube result, at least one cell immediately proximal to all the known mineral deposits were identified within the upper 2nd percentile of the ranked prospectivity score. HyperCube ranks criteria by creating rules, which are sets of related criteria that define a phenomenon or event. The rules generated for the Mt. Dore model revealed clearly that training cells cluster into different groups which can be tied to subtle variations in geological settings.

Figure 1: On the left side is the WofE predictive exploration map and on the right side the HyperCube map. Numbers correspond to training data (known IOCG deposits), and red zones correspond to high prospectivity target selection areas. Note that fewer training sites are identified as high prospectivity zones in the WofE result (e.g. training sites 1, 7, 11). Other case studies we have looked at demonstrate that HyperCube presents fewer false positives. The HyperCube map is simply a much more focused prospectivity map. ©2010 Department of Natural Resources and Mines, Queenland. All rights reserved
Meet the author:

John McGaughey, PhD – Founder and President at Mira Geoscience
John has extensive mining industry experience focusing on quantitative, multi-disciplinary 3D and 4D interpretation for mineral exploration and geotechnical decision support. He currently leads our technology strategy and our geotechnical business. Prior to founding Mira Geoscience in 1999, he spent 10 years at the Noranda Technology Centre as a Senior Scientist in their rock mechanics group. He obtained an MSc in geological engineering and a PhD in geophysics from Queen’s University. John is based in Montreal.
Latest news

Machine learning in mineral exploration

Documents linked to a project

Footprints project public data repository available soon

Importing objects from project

John McGaughey receives the Grahame Sands Award

Scripting

Themes
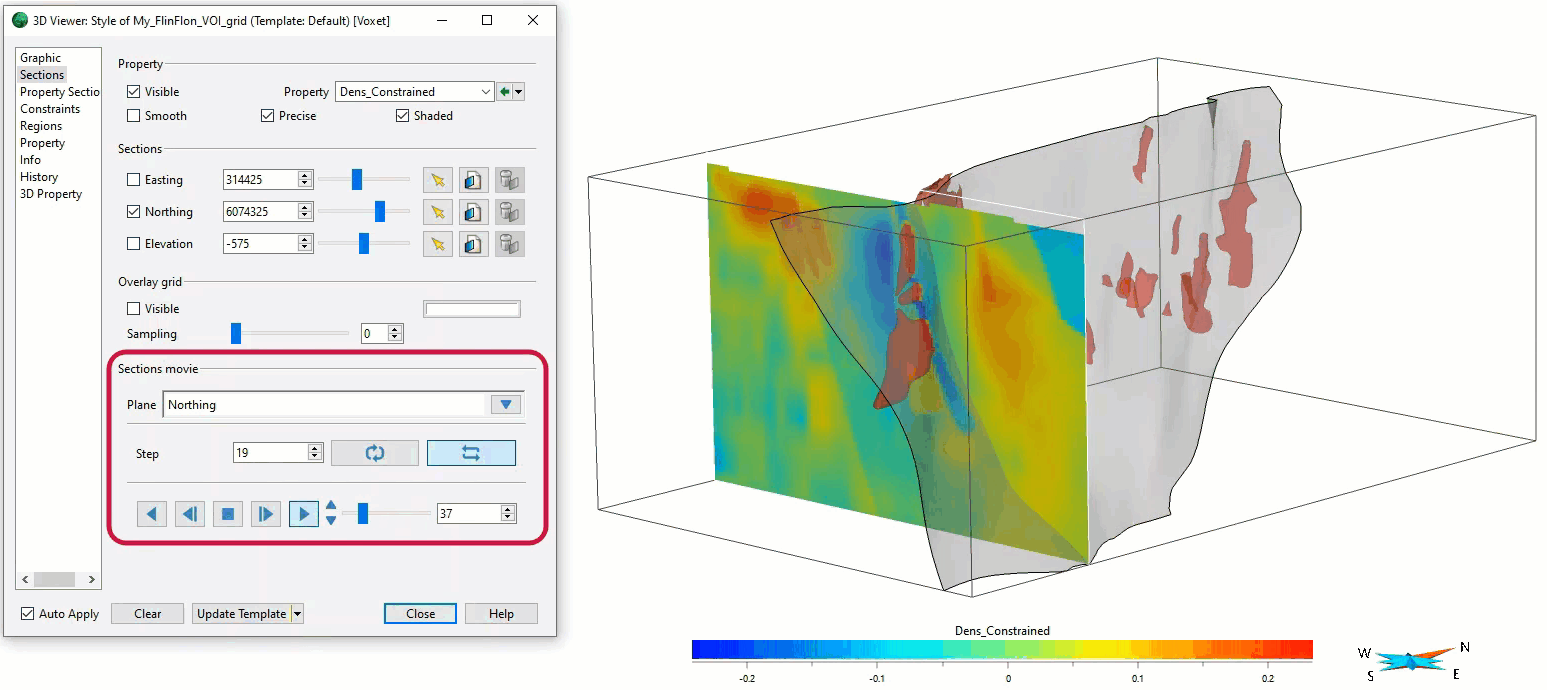
Sections movies
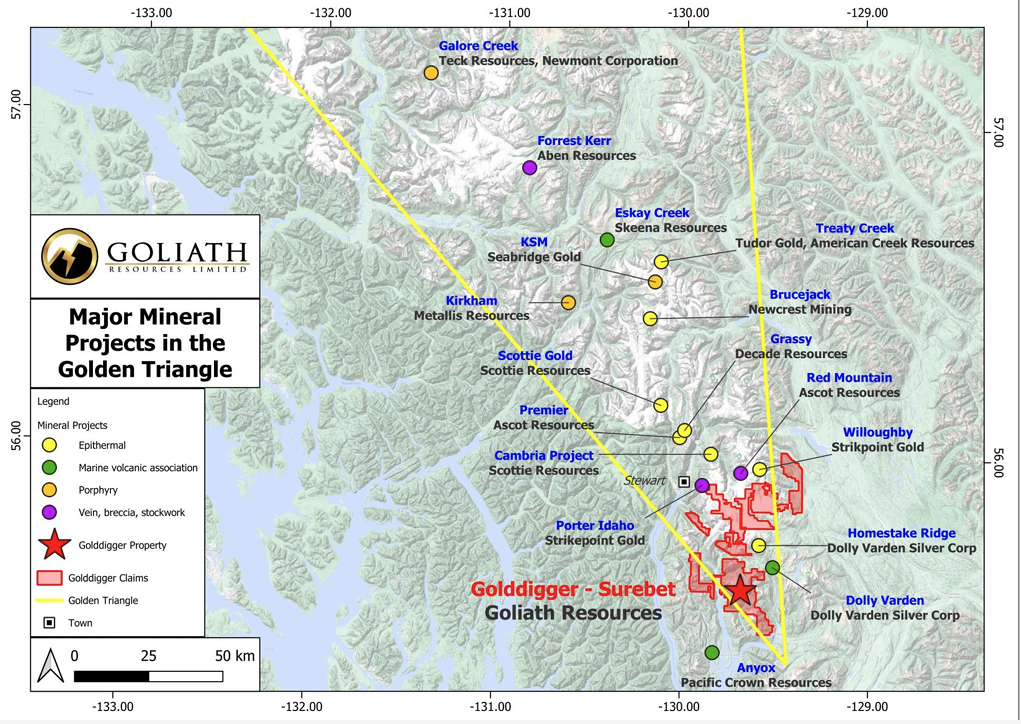
Remote Structural Mapping: A case study from the Golddigger property, BC

Pointer Tracking