


Did you know that you can texturally drape your images and 2D gridded data onto surfaces? For example, drape your geology map on your topography surface:
- Right-click on your surface > Style Editor
- Go to the Texture category
- In the Draping section, select Visible
- Choose your Voxet and the Property you would like to visualize

Previous tips can be found under the Software tip category in the Resources section and in the Archives section of our website.
Latest news
VPem3D in Geoscience ANALYST Pro Geophysics
Accelerating 3D TEM Interpretation with and without Geological Constraints. Read more >>

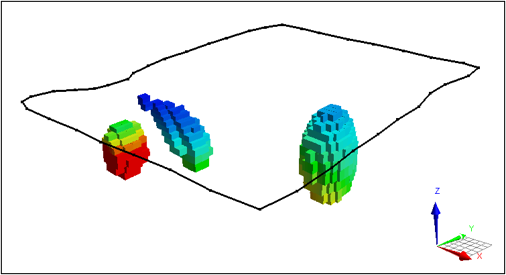
Snapshot grid sections
In GOCAD Mining Suite quickly take snapshots of your Voxet sections using the snapshot tool...

View neighbourhoods in 3D
You can display your neighbourhoods in Geoscience INTEGRATOR 3D viewer, making it easier to understand spatial distribution of the data.

Geological 3D-GIS query
In GOCAD Mining Suite, you can create points at specific geological contacts for the construction of your geological contact surface...

Automatic rotation
In Geoscience ANALYST you can autorotate viewport when presenting your 3D geoscientific data and models...

Data display precision
In Geoscience ANALYST Data Colours panel you can control the precision of the data...

Generating exploration models from a detailed structural interpretation and Artificial Intelligence
This approach uses the comment field of the logging table to extract general topics that can then be used as learning features in a supervised machine learning classification approach.


New release – GOCAD® Mining Suite V14.5
GMS V14.5 expands the Python API, enhances connectivity with Geoscience ANALYST, and improves interoperability through the open GEOH5 format.

R&D project with UDMN
We have been awarded a major R&D project from the Ultra Deep Mining Network (UDMN) called “4D Real-Time Geotechnical Hazard Assessment and Reporting”.

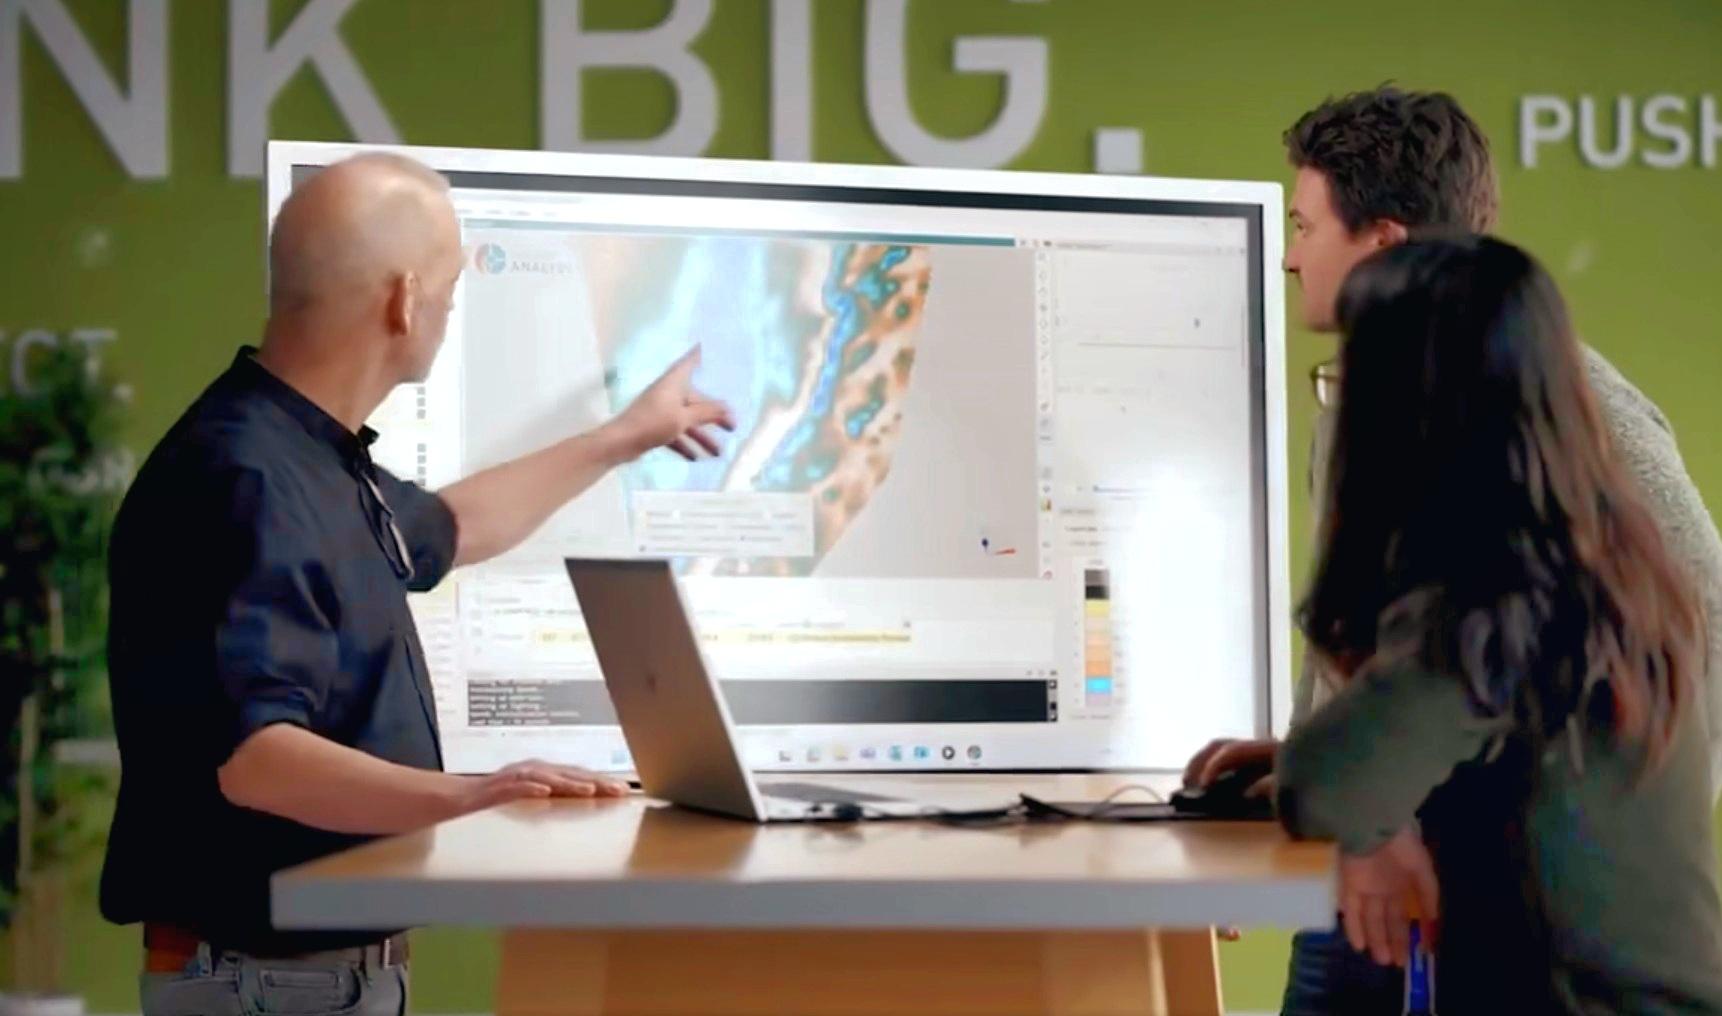
Revolutionizing Subsurface Interpretation and 3D Visualization with Geoscience ANALYST Pro
Discover how EnBW is bridging the gap between 2D mapping, 3D seismic interpretation, and integrated geophysical workflows