


Coloured bounding boxes are used to highlight volumes in the Viewport:
- A purple box surrounds your current selection.
- Blue-grey boxes highlight search results from the Objects panel or from the Data Set search tool.
- Yellow boxes highlight individual data sets selected from the Objects panel.
- A red box surrounds the search volume that will be used for querying.

Latest news

UBC-GIF or VP Suite inversion?
"The programs are complementary, and the combination gives one the ultimate flexibility in potential-field inversion,” says Kristofer Davis, Scientific Programmer at Mira Geoscience.

Filter records with, or without files associated to them
Geoscience INTEGRATOR offers the convenience of associating files to data records to...

How to run gravity inversions in a geologically driven way
Past event, view here or on our YouTube Channel to see how to run a 3D inversion and forward modelling in Geoscience ANALYST Pro using VPmg...

3D drillhole design and monitoring in Geoscience ANALYST Pro v4.0 – Virtual Lecture
Jennifer shows the new and updated drillhole design and monitoring tools in Geoscience ANALYST 4.0...
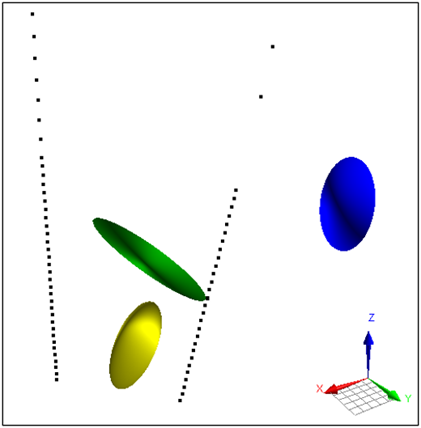
Parametric Ellipsoid Modelling in Geoscience ANALYST Pro Geophysics
We are evolving the way we organize and share our technical content to better support your needs.

Dynamically turn on/off classes in scatter plots
In Geoscience INTEGRATOR, you can turn on/off classes in scatter plots...

Building a geological framework from exploratory modelling of magnetic data – Virtual Lecture
Join us on May 19, 2022 at 11am Pacific Time as Shaun O'Connor will demonstrate how to use the built-in scripting tools for exploratory geological modelling with sparse data...

Q&A: Revival Gold Inc.
We discussed Mira Geoscience’s contribution to further understand the Beartrack-Arnett gold project area using modern exploration techniques...


Manual classifications vs Project classifications
In Geoscience INTEGRATOR, There are two ways to create classifications when importing data...

New clustering application in geoapps
geoapps - Exploratory Data Analysis (EDA), rock classification generation, or map alteration footprints

New importer: 2D SEG-Y
In Geoscience ANALYST you can visualize your block model data by volume in the Visual Parameters panel...
..