



Analyze your data with enhanced histogram display options available in GOCAD Mining Suite v19.
In addition to the pre-existing cumulative histograms, now you can compare data with curves, nested histograms, and overlaying histograms.

The histogram’s statistics reporting has also been updated to allow easy comparison of objects, regions, and properties statistics.
Previous tips can be found under the Software tip category in the News section and in the Archives section of our website.
Latest news

UBC-GIF or VP Suite inversion?
"The programs are complementary, and the combination gives one the ultimate flexibility in potential-field inversion,” says Kristofer Davis, Scientific Programmer at Mira Geoscience.

New release – Geoscience INTEGRATOR 4.2
Geoscience INTEGRATOR 4.2 unveils a range of new features and improvements designed to boost performance and enhance user experience.

Clipping isovalues and sections
In Geoscience ANALYST you can clip isovalues and sections by volume using the free visualization tools to focus on areas of interest in any block model...

Automatic rotation
In Geoscience ANALYST you can autorotate viewport when presenting your 3D geoscientific data and models...

Using predictive modelling in mineral exploration
We carried out targeting work for IOCG-style mineralisation in the Mt Dore area of QLD, Australia. We produced a 3D model and predictive exploration map...

DC resistivity inversion in Geoscience ANALYST Pro Geophysics
Past event, view here or via our YouTube channel...

Footprints project public data repository available soon
Project-generated and previously public data, models, and documents from the NSERC-CMIC mineral exploration project, “Integrated Multi-Parameter Footprints of Ore Systems...
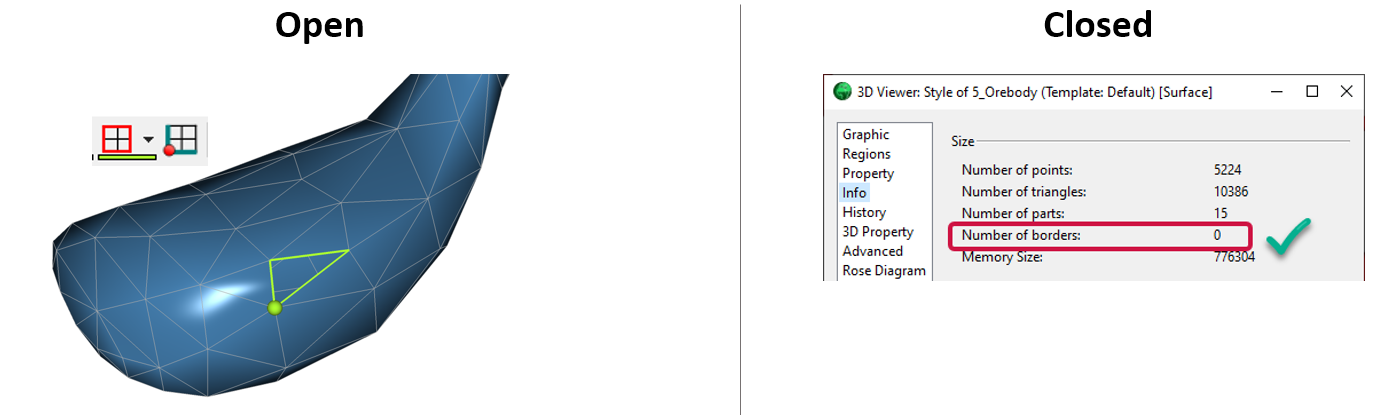
Is the surface opened or closed?
In GOCAD Mining Suite you can easily know if your surface is opened or closed by...

Show and hide
In Geoscience ANALYST you can show and hide everything, individual objects, container groups or drillhole groups...

R&D project with UDMN
We have been awarded a major R&D project from the Ultra Deep Mining Network (UDMN) called “4D Real-Time Geotechnical Hazard Assessment and Reporting”.

Inverting time domain data in Geoscience ANALYST version 4.0 – Virtual Lecture
Kristofer inverts TEM data in 1D through Geoscience ANALYST Pro Geophysics to recover conductivity in Geoscience ANALYST 4.0...

Q&A: Revival Gold Inc.
We discussed Mira Geoscience’s contribution to further understand the Beartrack-Arnett gold project area using modern exploration techniques...